1. Regression Coefficients
In many areas of study, researchers are interested in associations of one variable (X), with another variable (Y) controlling for other variables (Zs). For example, education researchers might wish to understand the relation between ethnicity and academic success, controlling for SES. Or a developmental researcher might be interested in whether (and to what extent) children’s use of relational aggression (e.g., gossiping about others, intentionally excluding someone from group activities) is associated with maladjustment, above and beyond their use of overt aggression (e.g., hitting, name calling, which is strongly correlated with relational aggression; see Card et al., 2008). In these cases, the central question involves the magnitude of unique, independent association between X and Y after controlling for Z (or multiple Zs).
In primary research, this situation is handled through multiple regression and similar techniques. Specifically, in these situations you would regress the presumed dependent variable (Y) onto both the predictor of interest (X) and other variables that you wish to control (one or more Zs). The well-known equation for this regression is (e.g., Cohen et al., 2003):
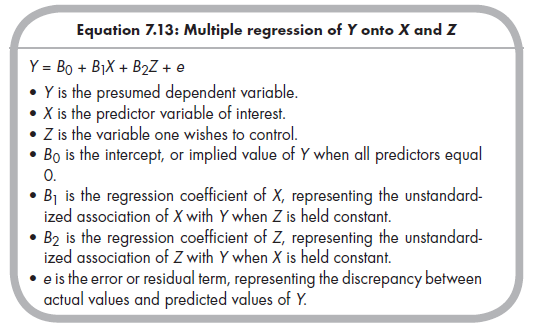
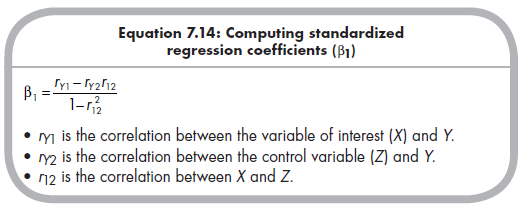
Here, the regression coefficient of X (B]) is of most interest. However, this value by itself is often less intuitive than several alternative indexes. The first possibility is the standardized regression coefficient, bi, which is inter-pretably similar to the unstandardized regression coefficient but expressed according to a range from 0 (no unique association) to ±1 (perfect unique association).7 If the X and Y variables are all measured according to a common scale, then the unstandardized regression coefficient may be meta- analyzed. But the more common situation of X and Y measured on different scales across different studies requires that we rely on the standardized regression coefficient. This standardized regression coefficient will often be reported in primary studies, but when only the component bivariate correlations are reported, you can rely on the following definitional formula (Cohen et al., 2003, p. 68) to compute this coefficient from correlations:
2. Semipartial correlations
Another index of the unique association is the semipartial correlation (sr), which is the (directional) square root of the variance of X that does not overlap with Z with all of Y (vs. the partial correlation, which quantifies the variance of this nonoverlapping part of X relative to the part of Y that does not overlap with Z). Although sr is often reported, you may need to calculate it from bivariate correlations using the following definitional formulas (Cohen et al., 2003, pp. 73-74):
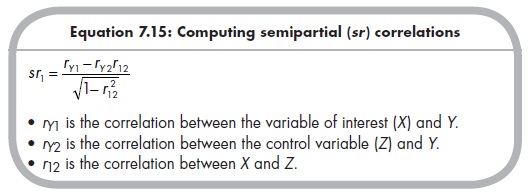
As with r, it is preferable to transform sr using Fisher’s Z transformation (Equation 5.2) before analysis and then back-transform average Zsr to sr or pr for reporting.
3. Standard Errors of Multivariate Effect Sizes
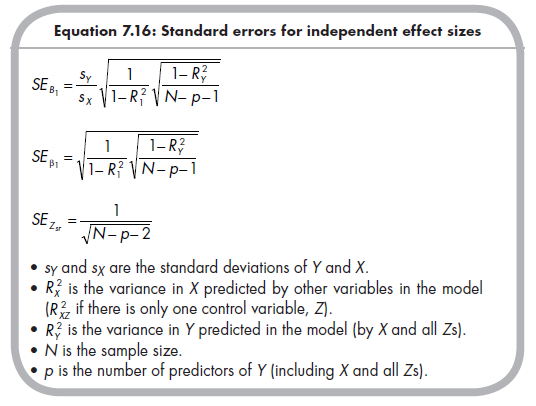
Thus far, I have talked about three potential effect sizes for meta-analysis of associations of X with Y, controlling for Z. As I describe further in Chapter 8, it is also necessary to compute standard errors for each for potential use in weighting meta-analytic combination and comparison across studies. The following formulas provide the standard errors for these four effect sizes (Cohen et al., 2003):
Having described the computations of independent associations and their standard errors, I need to caution you about their potential use in meta-analysis. A critical limiting factor in using these effect sizes from multiple regression analyses is that every study should include the same covariates (Zs) in analyses from which results are drawn. In other words, it is meaningful to compare the independent association between X and Y only if every study included in our meta-analysis controls for the same Z or set of Zs. If different studies include fewer or more, or simply different, covariates, then it makes no sense to combine the effect sizes of the type described here (i.e., regression coefficients, semipartial or partial correlations) from these studies.
If different studies do use different covariates, then you have two options, both of which require access to basic, bivariate correlations among all relevant variables (Y, X, and all Zs). The first option is to compute the desired effect sizes (i.e., regression coefficients, semipartial or partial correlations) from these bivariate correlations for each study and then meta-analyze these now-comparable effect sizes. This requires that all included studies report the necessary bivariate correlations (or you are able to obtain these from the authors). The second option is to meta-analyze the relevant bivariate correlations from each study in their bivariate form and then use these meta-analyzed bivariate correlations as sufficient statistics for multivariate analysis. This option is more flexible than the first one in that it can include studies reporting some but not all bivariate correlations. I discuss this latter approach in more detail in Chapter 12.
4. Differential Indices
Differential indices capture the magnitude of difference between two correlations within a study. Although these differential indices are rarely used, they do offer some unique opportunities to answer specific research questions. Next, I describe differential indices for both dependent and independent correlations.
4.1. Differential Index for Dependent Correlations
Meta-analysis of partial and semipartial correlations answers questions of whether a unique association exists between two variables, controlling for a third variable. For example, I might consider semipartial correlations of the association of relational aggression with rejection, above and beyond overt aggression. A slightly different question would be whether relational or overt aggression was more strongly correlated to rejection (see Card et al., 2008). More generally, the differential index for dependent correlations indexes the direction and magnitude of difference of two variables’ association with a third variable.
This differential index for dependent correlation, ddependent, is computed in a way parallel to the significance test to compare differences between dependent correlations (see Cohen & Cohen, 1983, pp. 56-57). This effect size of differential correlation of two variables (A and B) with a third variable (Y) is computed from the three correlations among these variables (Card et al., 2008):
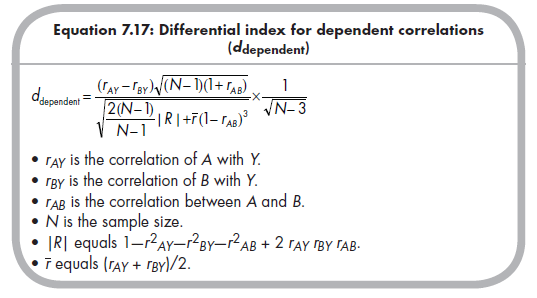
This differential index will be positive when the correlation of A with Y is greater than the correlation of B with Y, zero when these two correlations are equal, and negative when the correlation of B with Y is larger. This differential correlation can be meta-analytically combined and compared across studies to draw conclusions regarding the extent (or under what conditions) one association is stronger than the other.
4.2. Differential Index for Independent Correlations
The differential index can also be used to meta-analytically compare differences between independent correlations, that is, correlations drawn from different populations. Independent correlations may emerge within a single primary study when the primary research reports effect sizes for different subgroups. For example, in our example meta-analysis of relational aggression and rejection (Card et al., 2008), we were interested in evaluating gender differences in the magnitude of associations between relational aggression and rejection. This question is really one of moderation (Is the relational aggression with rejection link moderated by gender?), but here we compute the moderating effect within each study and subsequently meta-analyze the effect.
This differential index for independent correlations parallels the significance test to compare differences between independent correlations (see Cohen & Cohen, 1983, pp. 54-55). Given separately reported correlations for subgroups A and B within a single primary study, we apply Fisher’s transformation to each and then use the following equation to index the differential association for the two subgroups (Card et al., 2008):
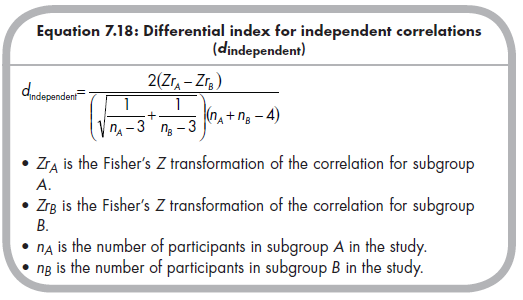
This differential index for independent correlations will be positive when the correlation is more positive (i.e., stronger positive or weaker negative) for subgroup A than B, negative when the correlation is more negative (i.e., weaker positive or stronger negative) for subgroup A than B, and zero when groups A and B have the same correlation. Meta-analytic combination across multiple studies providing data for this index provides evidence of whether (and how strongly) subgroup classification moderates this correlation.
Source: Card Noel A. (2015), Applied Meta-Analysis for Social Science Research, The Guilford Press; Annotated edition.
24 Aug 2021
24 Aug 2021
25 Aug 2021
24 Aug 2021
25 Aug 2021
24 Aug 2021