The purpose of testing statistical mediation is to understand the effects of a presumed mediating variable on the relationship between a scale or dichotomous predictor variable and a scale outcome variable. If mediation is occurring, the mediating variable will reduce the size of the relationship between the predictor and the outcome variable. Perfect mediation occurs when the mediator reduces the relationship between the independent variable and the outcome variable to zero. In the following assignment, we will see if there is a statistically significant relationship between math achievement and scholastic aptitude test – math, and then we will check to see if motivation mediates, or reduces, this relationship.
- Retrieve your data file: hsbdataNew.sav.
- Does motivation mediate the relationship between math achievement and scholastic aptitude test – math?
To conduct mediation in SPSS, we need to install a custom dialog box. SPSS includes the ability for users to write their own syntax and install new commands, which can result in new pull-down menu choices. Andrew Hayes wrote the PROCESS file (process.spd), which can be downloaded here (see Resource Hub for the latest version). By installing the program, we will have the ability to use the point and click method to conduct the mediation (and moderation) analyses.
Follow these steps to install the program:
- Go to Resource Hub to Download the latest version of PROCESS; or click here to download the PROCESS v4.2, then unzip it.
- Close SPSS if you have it open on your computer.
- Open SPSS as an administrator. To do this in Windows, click on Start → All Programs.
- Open the folder IBM SPSS Statistics.
- Right click on IBM SPSS Statistics 22 (or whatever version you have). A menu will appear.
- From the menu, select Run as administrator. A dialog box will appear asking if you want to let SPSS make changes to your computer.
- In the dialog box that appears, select Yes.
- Open SPSS and select Utilities → Custom Dialogs → Install Custom Dialog.
- Locate the file you downloaded (spd) and select Open. This will install PROCESS on your computer.
- After you complete these steps, you will find the PROCESS program by selecting Analyze → Regression → PROCESS, by Andrew F. Hayes http:afhayes.com.
Before we conduct the mediation analysis to answer our research question, we need to check the assumptions that the relationship between each of the predictor variables and the dependent variable are linear and that the error, or residual, is normally distributed and uncorrelated with the predictors. The assumption of linearity between the dependent variable and each of the predictor variables was checked through a matrix scatterplot (see Chapter 2 for how to compute this). All predictor variables were linearly related to the dependent variable. To check whether the error, or residual, is normally distributed and uncorrelated with the predictors we produced scatterplots for each regression (i.e., the IV predicting the DV, the IV and mediator predicting the DV, and the IV predicting the mediator). The assumptions that the variables have correct causal ordering and there is no reverse causality is assumed since all the data were collected at the same time.
When reporting regression results it is necessary to report means, standard deviations, and intercorrelations. If you need help producing these analyses, follow the steps in Chapter 2 and Appendix B.
Next, we need to run the analysis. With PROCESS, all of the regressions will be run at the same time and we will be able to assess if motivation mediates the relationship between math achievement and scholastic aptitude test – math. To do this, be sure you have loaded the PROCESS .spd program, then follow the steps below:
- Click on the following: Analyze → Regression → PROCESS, by Andrew F. Hayes (http://www.afhayes.com). The PROCESS Procedure for SPSS, written by Andrew F. Hayes (afhayes.com) window (Fig. 7.1) should appear.
- Select scholastic aptitude test – math and move it over to the Outcome variable (Y)
- Next select the variable math achievement and move it over to the Independent Variable (X)
- Select motivation and click it over to the M Variable(s)
- Under Model Number, be sure that 4 is selected. This tells SPSS that we are running a mediation analysis.
- Under Bootstrap Samples, be sure that 1000 is selected.
- Under Confidence level for confidence intervals select 95%.
- Under Covariate(s) in model(s) select …both M and Y.

Fig. 7.1. PROCESS Procedure for SPSS, written by Andrew F. Hayes (www.afhayes.com).
- Click on Options, click on Effect size (models 4 and 6), Total effect model (models 4 and 6 only), and Compare indirect effects (models 4 and 6 only). (See 7.2.)

Fig. 7.2. PROCESS Options.
- Click on Continue.
- Click on OK.
Compare your output and syntax to Output 7.1.
Output 7.1: Statistical Mediation
/* PROCESS for SPSS v2.10 */.
/* Written by Andrew F. Hayes */.
/* www.afhayes.com */.
/* Copyright 2013 */.
/* Read the documentation */.
/* available in Appendix A of */.
/* Hayes (2013) prior to use */.
/* www.guilford.com/p/hayes3 */.
/* For proper results, variable */.
/* names in data file must be distinct */.
/* in the first eight characters */.
set printback = off.
Matrix
Interpretation of Output 7.1
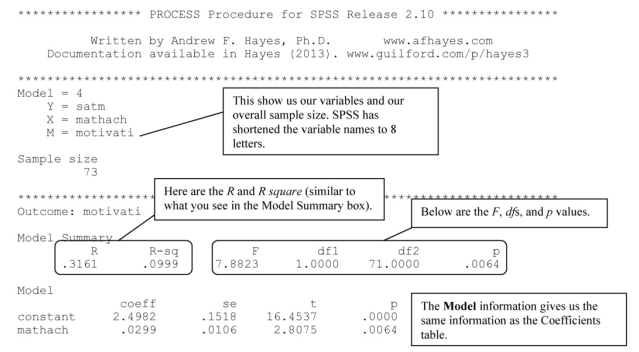
The first part of the output reports the variables: the dependent variable (Y) is scholastic aptitude test – math, the independent variable is math achievement, and the mediating variable (M) is motivation. Next we see the overall sample size is 73, therefore two participants did not have data for one or more of the variables.
The next part of the output shows information from the regression with the independent variable (math achievement) predicting the mediating variable (motivation). The Model Summary information shows that the multiple correlation coefficient (R) is .32 and R2 = .10, this indicates that math achievement explains 10% of the variance in motivation. The F, dfs, and p are similar to the information in an ANOVA table. The F = 7.88 and is statistically significant (p = .006). This indicates that math achievement statistically significantly predicts motivation.
For statistical mediation, the most important tables is the Coefficients table, with it being reported here as Model. First are the unstandardized b coefficients. We will use the unstandardized beta coefficients to know if the mediator, motivation, reduces the relationship between the two variables of math achievement and scholastic aptitude test – math. For now, we can interpret this as math achievement statistically significantly predicts motivation, b = .03, t = 2.81, p = .006.

Source: Leech Nancy L. (2014), IBM SPSS for Intermediate Statistics, Routledge; 5th edition;
download Datasets and Materials.
30 Mar 2023
27 Mar 2023
15 Sep 2022
15 Sep 2022
16 Sep 2022
28 Mar 2023