This SPSS tutorial shows how to use Weight Cases to apply a weighting variable, especially when your data measures counts.
1. Weighting Cases
In SPSS, weighting cases allows you to assign “importance” or “weight” to the cases in your dataset. Some situations where this can be useful include:
- Your data is in the form of counts (the number of occurrences) of factors or events. The “weight” is the number of occurrences.
- Your data requires adjustments to correct for over- or under-representation of certain characteristics in your sample. (This often happens with large surveys: a “weighting” variable is developed to adjust a sample’s composition to be reflective of the population’s composition, or to control for over- or under-reporting from a certain group.) The Pew Research Center often makes their raw survey data available online to the public. Many of these surveys include weighting as a part of the study methodology.
Weighting cases in SPSS works the same way for both situations.
To turn on case weights, click Data > Weight Cases.
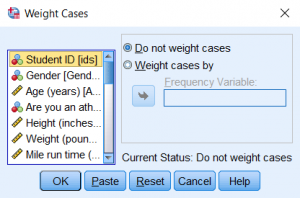
- To enable a weighting variable, click Weight cases by, then double-click on the name of the weighting variable in the left-hand column to move it to the Frequency Variable field. Click OK.
- To turn off an enabled weighting variable, open Weight Cases window again, and click Do not weight cases. Click OK.
2. Example: Reproducing an Existing 3×2 Table
Problem Statement
Suppose you are helping a friend with their statistics homework, and see that they have included the following write-up in their report:
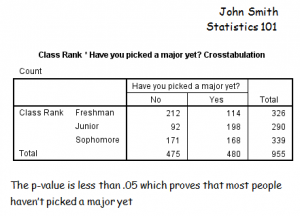
You immediately notice several things wrong with this report so far:
- You can never prove anything with a hypothesis test–not even if the p-value is really, really small.
- You do not see any test statistics anywhere, and it is unclear what test he has run.
You get the feeling that they may have used the Chi-square test of independence, but want to verify this for yourself.
Running the Procedure
Whenever you want to re-create a frequency table or crosstab, you first need to figure out how many unique combinations of the factors there are, and how many observations there were for each factor combination. In this situation, we have two variables: ClassRank (which has three levels) and PickedAMajor (which has two levels). So there are 3*2 = 6 unique factor combinations. They are:
| Freshman | No | 212 responses |
| Freshman | Yes | 114 responses |
| Sophomore | No | 171 responses |
| Sophomore | Yes | 168 responses |
| Junior | No | 92 responses |
| Junior | Yes | 198 responses |
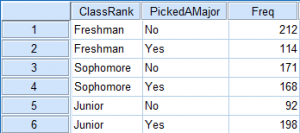
When we go to enter our data in SPSS, we will need to create three new variables: ClassRank, PickedAMajor, and a frequency variable (let’s name it “Freq”). After entering the data, your Data View window should look like this:
Now we need to weight the cases with respect to Freq. Click Data > Weight Cases.
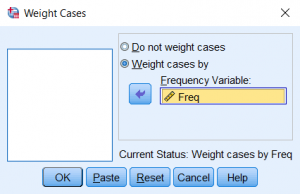
Click Weight cases by, then double-click Freq to move it to the Frequency Variable field. Click OK.
Now we can run our crosstab and verify your friend’s results. Click Analyze > Descriptive Statistics > Crosstabs.
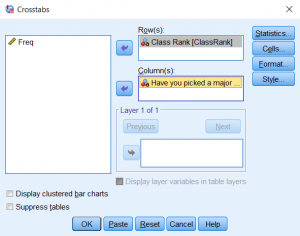
When the Crosstabs window opens, select the variable ClassRank in the left column and move it to the Row(s) field using the first arrow button, then select variable PickedAMajor in the left column and transfer it to the Column(s) field using the second arrow button. Doing this will reproduce the 3×2 table that your friend made.
To produce a Chi-square test of independence, click Statistics. This will open the Crosstabs: Statistics window. Select the Chi-square check box in the upper left-hand corner, then click Continue.
Click OK to run the crosstab.
Syntax
WEIGHT BY Freq.

CROSSTABS
  /TABLES=ClassRank BY PickedAMajor
  /FORMAT=AVALUE TABLES
  /STATISTICS=CHISQ
  /CELLS=COUNT
  /COUNT ROUND CELL.
Output
Within your output, you should see the following two tables:
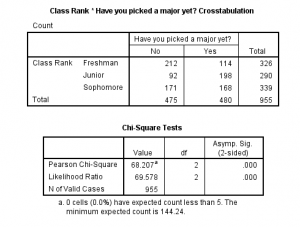
The 3×2 table matches your friend’s output. From the Chi-square Tests table, we see that this test result was significant at the 5% level (χ(2)=68.207, p < .001). From this result, we infer that there is a significant association between a student’s class rank and whether or not they have picked a major.
30 Mar 2023
29 Mar 2023
31 Mar 2023
20 Sep 2022
28 Mar 2023
30 Mar 2023