Many situations require information about a large group of elements (individuals, companies, voters, households, products, customers, and so on). But, because of time, cost, and other considerations, data can be collected from only a small portion of the group. The larger group of elements in a particular study is called the population, and the smaller group is called the sample. Formally, we use the following definitions.
The process of conducting a survey to collect data for the entire population is called a census. The process of conducting a survey to collect data for a sample is called a sample survey. As one of its major contributions, statistics uses data from a sample to make estimates and test hypotheses about the characteristics of a population through a process referred to as statistical inference.
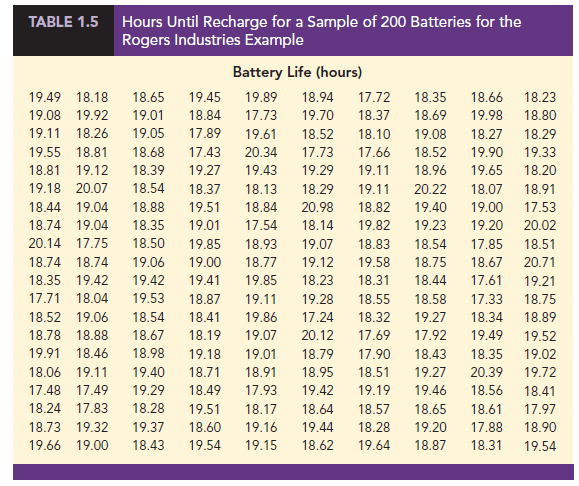
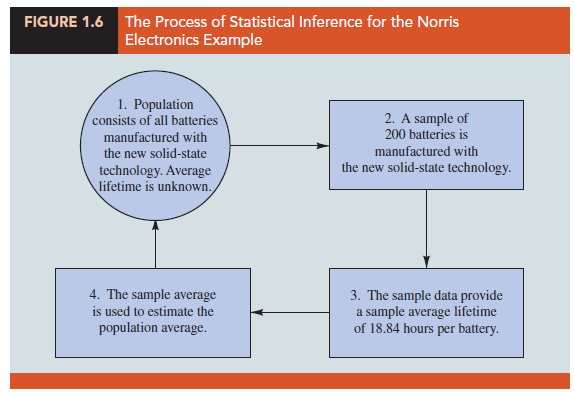
As an example of statistical inference, let us consider the study conducted by Rogers Industries. Rogers manufactures lithium batteries used in rechargeable electronics such as laptop computers and tablets. In an attempt to increase battery life for its products, Rogers has developed a new solid-state lithium battery that should last longer and be safer to use. In this case, the population is defined as all lithium batteries that could be produced using the new solid-state technology. To evaluate the advantages of the new battery, a sample of 200 batteries manufactured with the new solid-state technology were tested. Data collected from this sample showed the number of hours each battery lasted before needing to be recharged under controlled conditions. See Table 1.5.
Suppose Rogers wants to use the sample data to make an inference about the average hours of battery life for the population of all batteries that could be produced with the new solid-state technology. Adding the 200 values in Table 1.5 and dividing the total by 200 provides the sample average battery life: 18.84 hours. We can use this sample result to estimate that the average lifetime for the batteries in the population is 18.84 hours. Figure 1.6 provides a graphical summary of the statistical inference process for Rogers Industries.
Whenever statisticians use a sample to estimate a population characteristic of interest, they usually provide a statement of the quality, or precision, associated with the estimate. For the Rogers Industries example, the statistician might state that the point estimate of the average battery life is 18.84 hours ± .68 hours. Thus, an interval estimate of the average battery life is 18.16 to 19.52 hours. The statistician can also state how confident he or she is that the interval from 18.16 to 19.52 hours contains the population average.
Source: Anderson David R., Sweeney Dennis J., Williams Thomas A. (2019), Statistics for Business & Economics, Cengage Learning; 14th edition.
Hello everyone, it’s my first pay a quick visit at
this website, and post is really fruitful in support of me, keep up posting these types of articles.
What’s up, after reading this remarkable post i am as well happy
to share my knowledge here with friends.