Most of the statistical information in the media, company reports, and other publications consists of data that are summarized and presented in a form that is easy for the reader to understand. Such summaries of data, which may be tabular, graphical, or numerical, are referred to as descriptive statistics.
Refer to the data set in Table 1.1 showing data for 60 nations that participate in the World Trade Organization. Methods of descriptive statistics can be used to summarize these data.
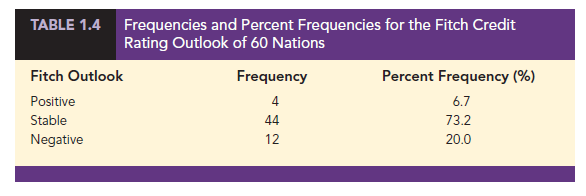
For example, consider the variable Fitch Outlook, which indicates the direction the nation’s credit rating is likely to move over the next two years. The Fitch Outlook is recorded as being negative, stable, or positive. A tabular summary of the data showing the number of nations with each of the Fitch Outlook ratings is shown in Table 1.4. A graphical summary of the same data, called a bar chart, is shown in Figure 1.4. These types of summaries make the data easier to interpret. Referring to Table 1.4 and Figure 1.4, we can see that the majority of Fitch Outlook credit ratings are stable, with 73.3% of the nations having this rating. More nations have a negative outlook (20%) than a positive outlook (6.7%).
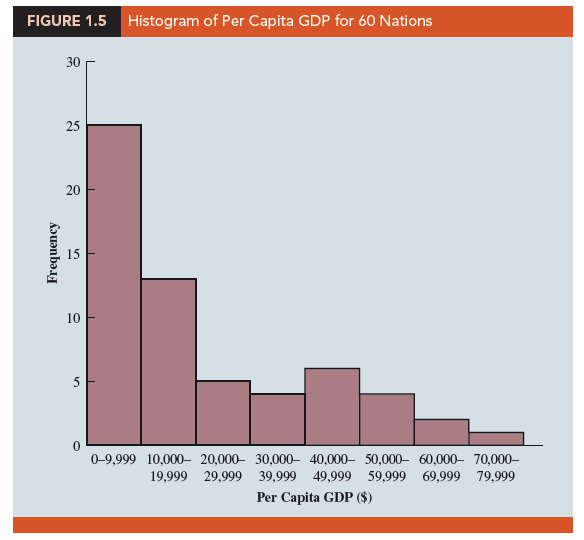
A graphical summary of the data for the quantitative variable Per Capita GDP in Table 1.1, called a histogram, is provided in Figure 1.5. Using the histogram, it is easy to see that Per Capita GDP for the 60 nations ranges from $0 to $80,000, with the highest concentration between $0 and $10,000. Only one nation had a Per Capita GDP exceeding $70,000.
In addition to tabular and graphical displays, numerical descriptive statistics are used to summarize data. The most common numerical measure is the average, or mean. Using the data on Per Capita GDP for the 60 nations in Table 1.1, we can compute the average by adding Per Capita GDP for all 60 nations and dividing the total by 60. Doing so provides an average Per Capita GDP of $21,279. This average provides a measure of the central tendency, or central location of the data.
There is a great deal of interest in effective methods for developing and presenting descriptive statistics.
Source: Anderson David R., Sweeney Dennis J., Williams Thomas A. (2019), Statistics for Business & Economics, Cengage Learning; 14th edition.
Hi there, I log on to your blog like every week. Your humoristic style is awesome, keep up
the good work!