In Section 19.3 the branch probabilities for the PDC decision tree chance nodes were specified in the problem description. No computations were required to determine these probabilities. In this section we show how Bayes’ theorem can be used to compute branch probabilities for decision trees.
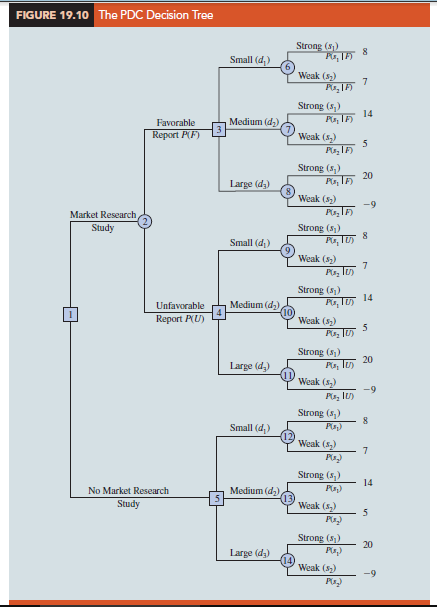
The PDC decision tree is shown again in Figure 19.10. Let
F = Favorable market research report
U = Unfavorable market research report
s1 = Strong demand (state of nature 1)
s2 = Weak demand (state of nature 2)
At chance node 2, we need to know the branch probabilities P(F) and P(U). At chance nodes 6, 7, and 8, we need to know the branch probabilities P(s1 | F), the probability of state of nature 1 given a favorable market research report, and P(s2 \ F), the probability of state of nature 2 given a favorable market research report. P(s1 | F) and P(s2 \ F) are referred to as posterior probabilities because they are conditional probabilities based on the outcome of the sample information. At chance nodes 9, 10, and 11, we need to know the branch probabilities P(s1 | U) and P(s2 | U); note that these are also posterior probabilities, denoting the probabilities of the two states of nature given that the market research report is unfavorable. Finally at chance nodes 12, 13, and 14, we need the probabilities for the states of nature, P(s1) and P(s 2), if the market research study is not undertaken.
In making the probability computations, we need to know PDC’s assessment of the probabilities for the two states of nature, P(s1) and P(s2), which are the prior probabilities as discussed earlier. In addition, we must know the conditional probability of the market research outcomes (the sample information) given each state of nature. For example, we need to know the conditional probability of a favorable market research report given that strong demand exists for the PDC project; note that this conditional probability of F given state of nature s1 is written P(F | s1). To carry out the probability calculations, we will need conditional probabilities for all sample outcomes given all states of nature, that is, P(F | Sj), P(F | s2), P(U | SJ), and P(U | s2). In the PDC problem, we assume that the following assessments are available for these conditional probabilities.
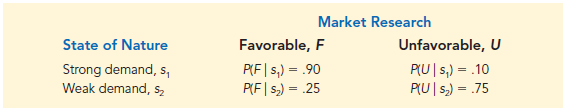
Note that the preceding probability assessments provide a reasonable degree of confidence in the market research study. If the true state of nature is sp the probability of a favorable market research report is .90, and the probability of an unfavorable market research report is .10. If the true state of nature is s2, the probability of a favorable market research report is .25, and the probability of an unfavorable market research report is .75. The reason for a .25 probability of a potentially misleading favorable market research report for state of nature s2 is that when some potential buyers first hear about the new condominium project, their enthusiasm may lead them to overstate their real interest in it. A potential buyer’s initial favorable response can change quickly to a “no thank you” when later faced with the reality of signing a purchase contract and making a down payment.
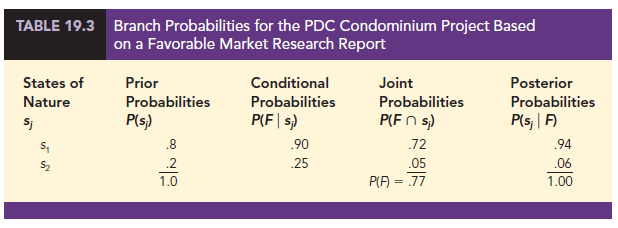
In the following discussion, we present a tabular approach as a convenient method for carrying out the probability computations. The computations for the PDC problem based on a favorable market research report (F) are summarized in Table 19.3. The steps used to develop this table are as follows:
Step 1. In column 1 enter the states of nature. In column 2 enter the prior probabilities for the states of nature. In column 3 enter the conditional probabilities of a favorable market research report (F) given each state of nature.
Step 2. In column 4 compute the joint probabilities by multiplying the prior probability values in column 2 by the corresponding conditional probability values in column 3.
Step 3. Sum the joint probabilities in column 4 to obtain the probability of a favorable market research report, P(F).
Step 4. Divide each joint probability in column 4 by P(F) = .77 to obtain the revised or posterior probabilities, P(s1 \ F) and P(s2 | F).
Table 19.3 shows that the probability of obtaining a favorable market research report is P(F) = .77. In addition, P(s1 | F) = .94 and P(s2 | F) = .06. In particular, note that a favorable market research report will prompt a revised or posterior probability of .94 that the market demand of the condominium will be strong, s1.
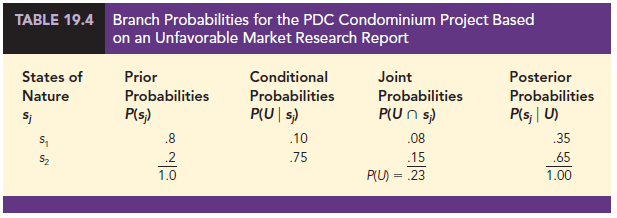
The tabular probability computation procedure must be repeated for each possible sample information outcome. Thus, Table 19.4 shows the computations of the branch probabilities of the PDC problem based on an unfavorable market research report. Note that the probability of obtaining an unfavorable market research report is P(U) = .23. If an unfavorable report is obtained, the posterior probability of a strong market demand, s1, is .35 and of a weak market demand, s2, is .65. The branch probabilities from Tables 19.3 and 19.4 were shown on the PDC decision tree in Figure 19.5.
The discussion in this section shows an underlying relationship between the probabilities on the various branches in a decision tree. To assume different prior probabilities, P(s1) and P(s2), without determining how these changes would alter P(F) and P(U), as well as the posterior probabilities P(s1 ∙ F), P(s2 ∙ F), P(s1 ∙ U), and P(s2 ∙ U), would be inappropriate.
Source: Anderson David R., Sweeney Dennis J., Williams Thomas A. (2019), Statistics for Business & Economics, Cengage Learning; 14th edition.
30 Aug 2021
28 Aug 2021
30 Aug 2021
31 Aug 2021
30 Aug 2021
28 Aug 2021