Although there appears to be value in short-term patterns, they are not immediate sources of wealth without study, experience, and trial-and-error testing. We have only touched the edge of methods being used. Others include performance around national holidays, days of the week, time during the day, and even the new moon. There seems to be no limit. The point in this exercise, however, is to demonstrate the many ways that prices are analyzed over the short term. If interested, you can continue to experiment on your own.
1. Candlestick Patterns
In Chapter 11, “History and Construction of Charts,” we learned how to construct a candlestick chart. As you will recall, the raw data used in the candlestick chart is the same as the raw data used in the bar chart: open, close, high, and low price per specific period.
The candlestick chart has become popular because it represents price action in a more striking way; furthermore, the patterns that result have interesting and novel names. One advantage of the candlestick chart is that it can still use the Western methods of analysis—patterns, trend lines, support, and resistance—yet it has a set of unique patterns of its own. These patterns are mostly short term of only one to five bars, and by themselves they have not tested well. Many patterns have their Western equivalents that we have seen before. They are generally reversal patterns and can reveal price reversals early in overbought or oversold conditions, at trend lines, or at support or resistance levels. However, they are tools, not a system. Their disadvantage is that one must wait for the close before a pattern can be recognized, and they are useless in markets that do not accurately report the opening prices. The best resource on candlesticks is Japanese Candlestick Charting Techniques by Steve Nison (2001), the person who introduced this ancient method to the West.
The principal analytical difference between candlestick patterns and Western bar patterns is the emphasis on the opening and close. Western traders have recognized the importance of the opening and close, but bar charts treat them without special weighting. In candlestick charts, the “real body” is the wider area between the open and close. The “shadow” is the vertical line from the real body up to the price high and down to the price low. A long shadow indicates the inability for prices to maintain their highs or lows and is, thus, a warning of trouble. The real body is a heavy color, such as black, when the close is lower than the open, and usually white when the close is higher than the open. A black body denotes, therefore, a “down” day, and a white body indicates an “up” day. (This definition is different than in the West, where a down day is a day in which the close is lower than the previous close.) A large body (in relative terms) indicates strength in the direction of the trend, and a small body indicates indecision and a potential reversal, especially after a meaningful prior trend.
Patterns are made by the relative position of the body and the shadow, the location of the candlestick in relation to its neighbors, and the confirmation the next day. Because candlestick patterns usually are defined as top or bottom patterns, the analyst must be sure that the preceding price action is in a trend, either up or down. A single pattern may or may not be meaningful depending on the direction of the previous trend. Similar to Western short-term patterns, a candlestick pattern cannot predict the extent of the subsequent move or the significance of the pattern—that is, whether it occurs at a major or minor reversal. Thus, the pattern should always be used with other evidence before action is taken. For example, candlestick patterns are often reversal patterns and thus identify support or resistance levels when they switch direction. At first, the analysis of these patterns seems to be filled with an endless set of rules and names, but as you become more familiar with the nomenclature, you will see that the basis of these patterns is not much different from the basis for Western short-term patterns.
There have been few tests on the effectiveness of candlestick patterns. This is odd because the patterns are easily computerized. As with tests of other short-term patterns, many of the existing studies are flawed in that the signal outcomes are often assumed to last longer than they should. Measuring the effectiveness of patterns over weeks or months is useless because these patterns are only useful in short-term situations. However, even over shorter periods, the patterns do not test well. Their profit factors are relatively low, and their drawdowns are high and in all cases greater than net profits. Some of the variables in each pattern can be tweaked to improve performance, but the basic patterns, by themselves, are not outstandingly profitable.
Two relatively recent studies with short-term results are by Caginalp and Laurent (1998) and by Schwager (1996). The Caginalp and Laurent tests included eight three-day patterns in S&P 500 stocks from 1992 to 1996. Their purpose was to demonstrate that the patterns had value above what could be expected from a random walk; however, drawdowns were not considered. Schwager tested six major patterns in ten commodities from 1990 to 1994 and included a momentum filter to account for trend, an important factor in candlestick pattern analysis. A criticism, however, is that Schwager estimated commissions and slippage to be $100 per trade, considerably higher than what can be achieved now. Both studies suffer from the type of exit method in that they depend on a holding period that is arbitrary and not based on the behavior of prices.
The results could be considerably improved with testing of each pattern in combination with others and the use of protective stops. At least stops and other exit signals would reduce the extremely large drawdowns. In our presentation of the patterns covered by Schwager, we average the results from the ten commodities for each pattern and give the relative ranking rather than the raw percentages. This avoids, to some extent, the problem of commissions and slippage.
Following are some examples of the more common candlestick patterns.
2. One- and Two-Bar Candlestick Patterns
Candlestick patterns are short-term patterns. In fact, a number of candlestick patterns are formed by only one or two bars. Thus, on a candlestick chart of daily data, only one or two days’ worth of data would be necessary to form the pattern.
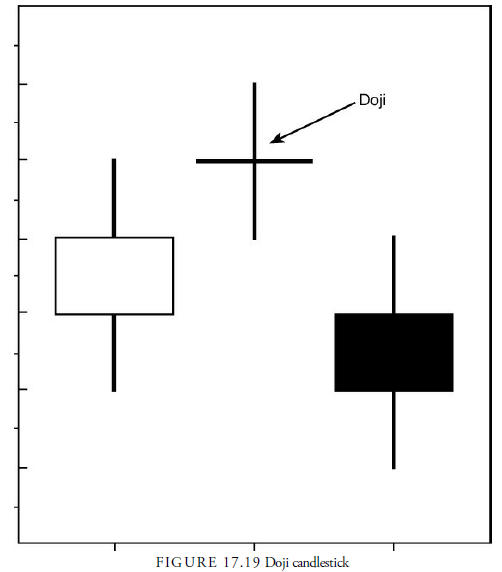
3. Doji
A doji pattern is formed when the open and close are identical, or nearly identical. This creates a candlestick with a real body that is simply a horizontal line, as shown in Figure 17.19. It suggests that the market is in equilibrium and affected by indecision. In some respects, it is like an inside bar in its meaning because in a trend, it shows a point at which the enthusiasm of the trend has stalled. It is, thus, often a warning of a reversal, but not necessarily a reversal pattern by itself. It can also occur about anywhere during a trend or within a trading range and is, thus, difficult to assess. As a result, its performance statistics were low (Schwager, 1996). It ranked at the bottom of our scale based on net profit, average trade, maximum drawdown, and percent winners.
4. Windows
Windows are simply the gaps that we discussed earlier in this chapter. Nison believes they are the most reliable formations, and evidence from short-term bar patterns tends to confirm his opinion. Because the interpretation of candlestick windows is the same as for Western gaps, we will not spend time discussing them.
5. Harami
A harami pattern is a two-day pattern consisting of a large body of either color followed by a small body of either color that is completely within the boundaries of the large body. The harami pattern is pictured in Figure 17.20. The second candlestick pictured in the harami pattern in Figure 17.20 is called a spinning top. This second candlestick can also be a doji (resulting in a harami cross pattern), a hammer, a hanging man, or a shooting star; the only requirement is that the second candlestick body is within the first candlestick body.
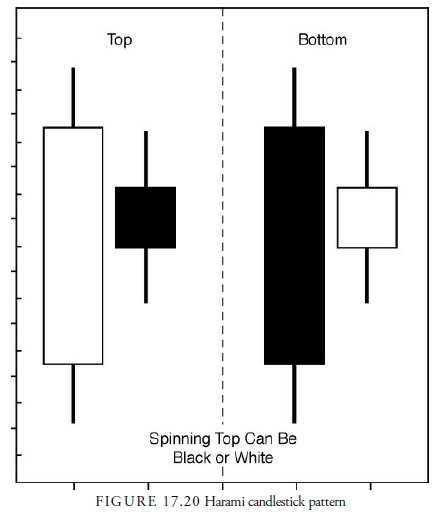
The harami pattern is similar to the inside bar pattern; however, with the harami, the range, or wick, of the second bar does not have to be within the range of the first bar. The real body of the second candle must be within the real body of the first candle. Thus, the open and close range, rather than the range, determines whether the harami criterion is met.
We know that the inside day demonstrates a contraction in volatility, and the same can be said for the harami pattern. We also know from studies of short-term bar patterns that low volatility turns into high volatility and often begins a new trend. Thus, a harami pattern can be a powerful way of signaling either the reversal of a trend or an increase in velocity of the current trend, depending on which direction prices break.
6. Hammer and Hanging Man
Both the hammer and the hanging man are candlesticks in which the real body is located at the upper end of the trading range, as pictured in Figure 17.21. For these formations, the lower wick is at least twice to three times as long as the body, and the upper wick is small or nonexistent. In other words, both the open and close occur within approximately the top one-third of the bar’s trading range, and either the open or close is, or nearly is, the highest price of the bar. The color of the body is irrelevant.

If this formation occurs at a peak, it is called a hanging man. A variation is called the kasakasa or paper umbrella when the body is shorter than the shadow. When the same formation occurs at a trough, it is called a hammer. These formations ranked best in our scale and were close to a tie with morning and evening stars.
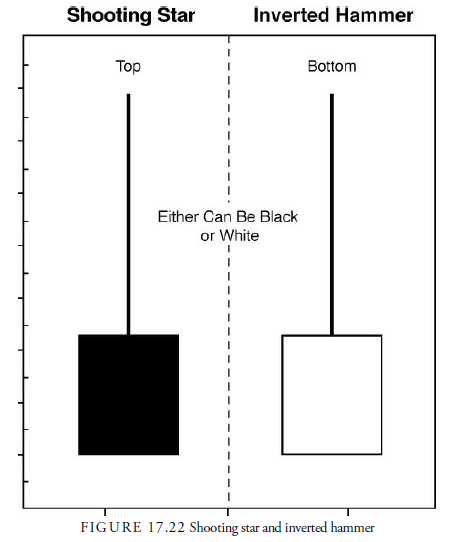
7. Shooting Star and Inverted Hammer
The shooting star and the inverted hammer can be thought of as an upside down hanging man or hammer. For these formations, the real body occurs in the lower end of the trading range. A shooting star occurs at peaks, and the inverted hammer occurs at bottoms. Both have long shadows above their bodies and short or nonexistent shadows below their bodies, as shown in Figure 17.22. Again, the color of the body is irrelevant. In our ranking of patterns, they fell into the middle, nowhere near the best-performing hammer and hanging man to which they are related.
8. Engulfing
An engulfing pattern is a two-bar pattern in which the second body engulfs the first body (see Figure 17.23). This pattern is similar to an outside day reversal in bar patterns. Because this pattern is designed to recognize a trend reversal, there must be a clear trend preceding the engulfing pattern. In a market uptrend, a bearish engulfing pattern would indicate a market top. The bearish engulfing pattern consists of a small whitebodied candle followed by a black body that engulfs the white body. The bullish engulfing pattern would indicate that a downward trend is reversing. This bullish engulfing pattern consists of a candle with a small dark body on one bar followed by a candle with a larger white body that engulfs the dark body. For both the bearish and bullish engulfing pattern, the signal is much stronger when the first body is small and the second body is large. However, performance of engulfing patterns is near the bottom of the six pattern types tested by Schwager. They had the worst net profits and the largest maximum drawdowns.

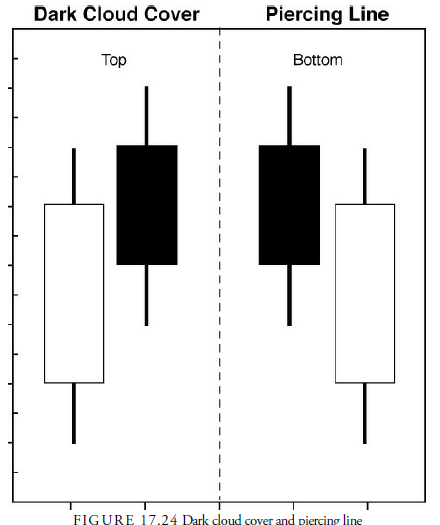
9. Dark Cloud Cover and Piercing Line
A dark cloud cover is a two-body pattern at a top. The first body is large and white, and the second body is large and dark. The second open should be above the upper shadow of the first bar, an opening gap upward, and the close well within the first bar’s white body, preferably below the 50% level. The pattern resembles the Oops! pattern in bar charts. Performance of this pattern is supposedly enhanced by a deeper penetration of the white body. (A complete penetration would be an engulfing pattern.)
The opposite pattern, a piercing line pattern, would indicate market bottom. The piercing line follows the same rules as the dark cloud pattern, only in reverse. Both the dark cloud cover and piercing line formations are pictured in Figure 17.24. These patterns ranked in the lower half of the six types followed. They had the second to least drawdown, the lowest average profit per trade, and the lowest winning percentage.
10. Multiple-Bar Patterns
Multiple-bar candlestick patterns develop over a time period of more than two bars. A quick glance at names such as “three black crows,” “three white soldiers,” and “three outside up” reveals that many of the multiple-bar patterns are three-bar patterns.
The evening star is a three-bar candlestick pattern that occurs at market tops, and the morning star is a three-bar, market bottom pattern. In each of these patterns, the second bar, or middle candlestick, is known as a star. A star is a candlestick that has a small body that lies outside the range of the body before it. It implies an opening gap, as does a dark cloud and piercing line pattern, but it can later cover part of the previous bar’s shadow. The important point is that its body does not overlap the previous bar’s body at all. It is similar to a doji in that it represents a sudden halt in a trend and some indecision between buyers and sellers. Indeed, a doji can be a star, called a doji star, if the doji body occurs outside the body of the previous bar’s body.
The evening star pattern, pictured in Figure 17.25, starts with a long white body followed by a star of either color. If the third bar forms a large black body that closes well within the body of the first bar, the pattern is confirmed. Ideally, the third body should not touch the star’s body, but this rarely occurs, and it is not a necessary condition for the pattern. The amount of penetration into the first white body is more important. The evening star is similar to the island reversal bar pattern without the necessary second gap.
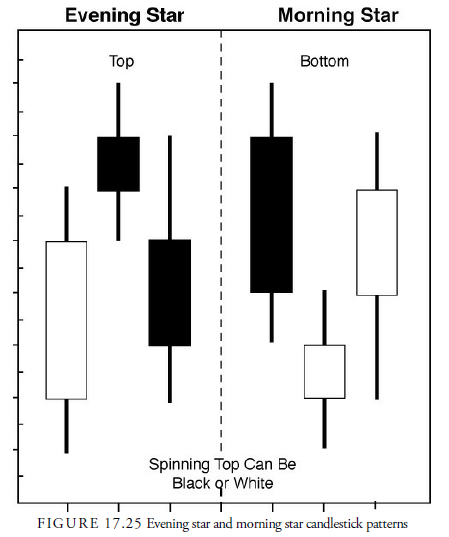
The morning star, which occurs at a market bottom, is the opposite formation of the evening star. As shown in Figure 17.25, it begins with a black-bodied candlestick, followed by a star. The body of the star lies completely below the body of the previous candlestick. The pattern is then confirmed if, on the third bar, a white-bodied candlestick closes well within the range of the first candlestick.
The morning and evening stars were the second-best patterns in our ranking of Schwager’s tests. They were first in net profits, had the least drawdowns, and were second in the percentage of winning trades. In the Caginalp and Laurent study, the morning and evening star pattern ranked third out of the four multibar types studied.
11. Three Black Crows and Three White Soldiers
White soldiers are white bodies and black crows are black bodies. Three black crows is a pattern with three consecutive, preferably long, black bodies, closing near their lows with openings within their previous day’s body, and occurring after a meaningful upward trend. They are a top-reversal formation. As shown in Figure 17.26, three white soldiers is a bottom-reversing formation that requires the same parameters in the opposite direction.

Unfortunately, traders have difficulty profiting from these patterns because by the time they are recognized, a large portion of the new trend has already occurred. They are best played on a pullback or a throwback. Nison believes that the first or second bar in the pattern is the best location for entry on the retracement. That level is often accompanied by another pattern suggesting a short reversal in the direction of the trend signaled by the major pattern.
12. Three Inside Up and Three Inside Down
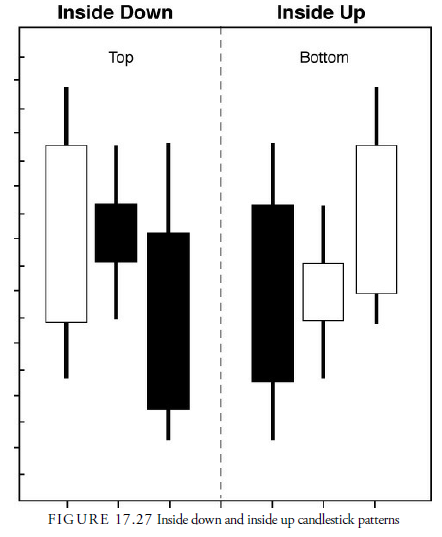
The three inside up pattern is a reversal pattern that occurs at the end of a declining trend. The first bar of this pattern has a large black body, and the second bar is a white spinning top (or doji) that forms a harami pattern. Then the third bar is a large, white candle that breaks and closes above the large black body of the first bar. Although the name may sound like it, the three inside up pattern does not imply that three inside bars in a row occur, as we saw with the NR3 pattern. Instead, the three inside up pattern is similar to an upward breakout from an inside bar in a bar pattern.
As shown in Figure 17.27, the three inside down pattern is the reverse of the three inside up pattern. The three inside down pattern consists of a large white bar followed by a black spinning top and a downward break by a large black body. This pattern signals that an upward trend has ended. From the Caginalp and Laurent study, we ranked this pattern type the best. It had the highest percentage of winning trades of the four pattern types studied.
From our look at short-term bar patterns, we know that outside bars are less predictable and less profitable than inside bars because the volatility has already expanded and is open to contraction at any time soon thereafter. The results of the three outside bar pattern types show the same decreased performance and were ranked fourth in our interpretation of the Caginalp and Laurent study.
13. Three Outside Up and Three Outside Down
This pattern type starts with an engulfing pattern after a trend, just as the inside up and down started with a harami pattern. The three outside up version occurs at market bottoms. The first body is small, a spinning top, and the second body is large, engulfing the smaller previous body. The first is black and the second is white. A white body that closes above the second bar and reaches a new high above the previous two bars follows the engulfing pattern. This pattern is pictured in Figure 17.28.

Figure 17.28 also shows how the three outside down pattern is the same with opposite parameters. For the outside down pattern, the first bar is a small, white body, and the second bar is a black body that engulfs the first. The third bar is also a black body with prices moving lower than the second bar. Outside down bars occur at market tops.
14. Candlestick Pattern Results
We have described several of the most popular candlestick patterns. Bulkowski maintains a Web site (www.thepatternsite.com) with an extensive list of candlestick patterns. Table 17.1 highlights Bulkowski’s ranking of the ten best-performing candlestick patterns.

Source: Kirkpatrick II Charles D., Dahlquist Julie R. (2015), Technical Analysis: The Complete Resource for Financial Market Technicians, FT Press; 3rd edition.
Your place is valueble for me. Thanks!…