A single item in a financial statement, such as net income, is often useful in interpreting the financial performance of a company. However, a comparison with prior periods often makes the financial information even more useful. For example, comparing net income of the current period with the net income of the prior period will indicate whether the company’s operating performance has improved.
In horizontal analysis, the amount of each item on a current financial statement is compared with the same item on an earlier statement. The increase or decrease in the amount of the item is computed together with the percent of increase or decrease. When two statements are being compared, the earlier statement is used as the base for computing the amount and the percent of change.
To illustrate, the horizontal analysis of two income statements for J. Holmes, Attorney- at-Law, is shown on the following page.
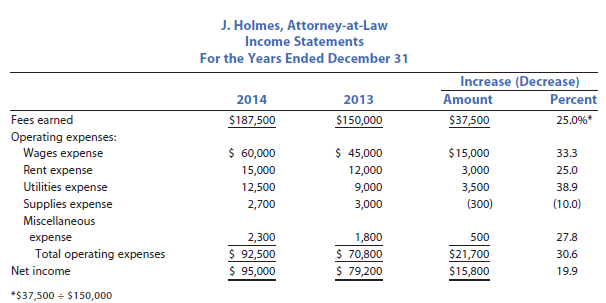
The horizontal analysis for J. Holmes, Attorney-at-Law, indicates both favorable and unfavorable trends. The increase in fees earned is a favorable trend, as is the decrease in supplies expense. Unfavorable trends include the increase in wages expense, utilities expense, and miscellaneous expense. These expenses increased the same as or faster than the increase in revenues, with total operating expenses increasing by 30.6%. Overall, net income increased by $15,800, or 19.9%, a favorable trend.
The significance of the various increases and decreases in the revenue and expense items should be investigated to see if operations could be further improved. For example, the increase in utilities expense of 38.9% was the result of renting additional office space for use by a part-time law student in performing paralegal services. This explains the increase in rent expense of 25.0% and the increase in wages expense of 33.3%. The increase in revenues of 25.0% reflects the fees generated by the new paralegal.
The preceding example illustrates how horizontal analysis can be useful in interpreting and analyzing the income statement. Horizontal analyses can also be performed for the balance sheet, the retained earnings statement, and the statement of cash flows.
To illustrate, horizontal analysis for two recent years of Apple Inc.’s statements of cash flows (in millions) is shown below.
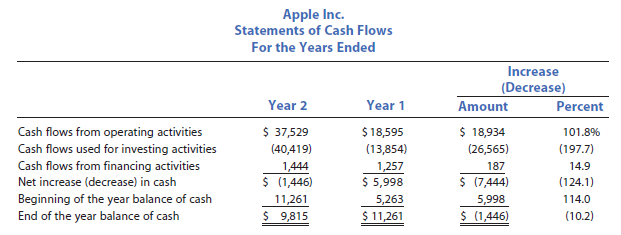
The horizontal analysis of cash flows for Apple Inc. indicates an increase in cash flows from operating activities of 101.8%, which is a favorable trend. At the same time, Apple increased the cash used in its investing activities by 197.7% and increased the cash it received from financing activities by 14.9%. Overall, Apple had a 124.1% decrease in cash for the year, which decreased the end-of-the-year cash balance by 10.2%. In contrast, in the prior year Apple decreased its ending cash balance, which is the beginning cash balance of the current year, by 114.0%.
Source: Warren Carl S., Reeve James M., Duchac Jonathan (2013), Corporate Financial Accounting, South-Western College Pub; 12th edition.
It’s really a great and useful piece of info. I’m happy that you simply shared this useful information with us.
Please stay us up to date like this. Thanks for sharing.
I’m not sure where you’re getting your information, but good
topic. I needs to spend some time learning more or understanding more.
Thanks for excellent info I was looking for this info for my mission.