Profitability analysis focuses on the ability of a company to earn profits. This ability is reflected in the company’s operating results, as reported in its income statement. The ability to earn profits also depends on the assets the company has available for use in its operations, as reported in its balance sheet. Thus, income statement and balance sheet relationships are often used in evaluating profitability.
Common profitability analyses include the following:
- Ratio of net sales to assets
- Rate earned on total assets
- Rate earned on stockholders’ equity
- Rate earned on common stockholders’ equity
- Earnings per share on common stock
- Price-earnings ratio
- Dividends per share
- Dividend yield
1. Ratio of Net Sales to Assets
The ratio of net sales to assets measures how effectively a company uses its assets. It is computed as follows:
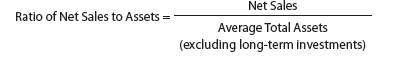
As shown above, any long-term investments are excluded in computing the ratio of net sales to assets. This is because long-term investments are unrelated to normal operations and net sales.
To illustrate, the ratio of net sales to assets for Lincoln Company is computed below. Total assets (excluding long-term investments) are $1,010,000 at the beginning of 2013.
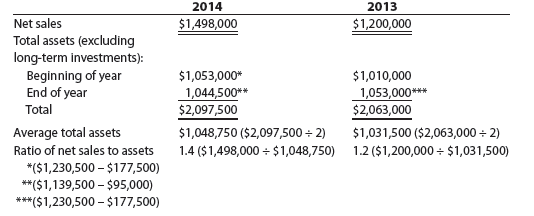
For Lincoln Company, the average total assets was computed using total assets (excluding long-term investments) at the beginning and end of the year. The average total assets could also be based on monthly or quarterly averages.
The ratio of net sales to assets indicates that Lincoln’s use of its operating assets has improved in 2014. This was primarily due to the increase in net sales in 2014.
2. Rate Earned on Total Assets
The rate earned on total assets measures the profitability of total assets, without considering how the assets are financed. In other words, this rate is not affected by the portion of assets financed by creditors or stockholders. It is computed as follows:
![]()
The rate earned on total assets is computed by adding interest expense to net income. By adding interest expense to net income, the effect of whether the assets are financed by creditors (debt) or stockholders (equity) is eliminated. Because net income includes any income earned from long-term investments, the average total assets includes long-term investments as well as the net operating assets.
To illustrate, the rate earned on total assets by Lincoln Company is computed below. Total assets are $1,187,500 at the beginning of 2013.
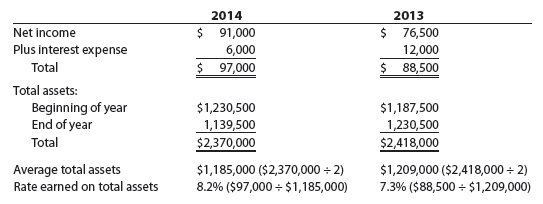
The rate earned on total assets improved from 7.3% to 8.2% during 2014.
The rate earned on operating assets is sometimes computed when there are large amounts of nonoperating income and expense. It is computed as follows:
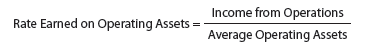
Since Lincoln Company does not have a significant amount of nonoperating income and expense, the rate earned on operating assets is not illustrated.
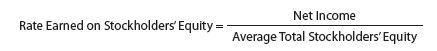
3. Rate Earned on Stockholders’ Equity
The rate earned on stockholders’ equity measures the rate of income earned on the amount invested by the stockholders. It is computed as follows:
To illustrate, the rate earned on stockholders’ equity for Lincoln Company is computed below. Total stockholders’ equity is $750,000 at the beginning of 2013.
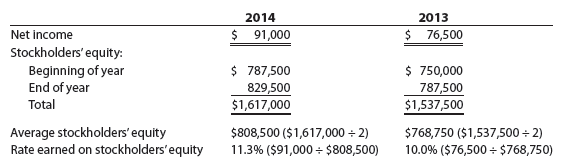
The rate earned on stockholders’ equity improved from 10.0% to 11.3% during 2014. Leverage involves using debt to increase the return on an investment. The rate earned on stockholders’ equity is normally higher than the rate earned on total assets. This is because of the effect of leverage.
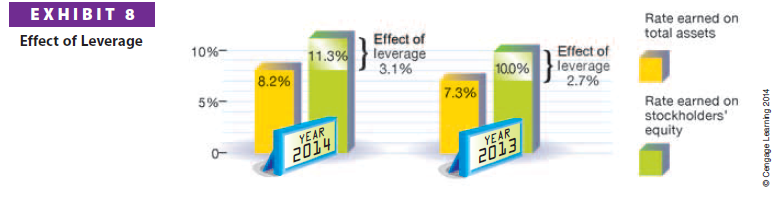
For Lincoln Company, the effect of leverage for 2014 is 3.1% and for 2013 is 2.7%
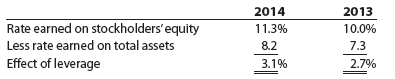
Exhibit 8 shows the 2014 and 2013 effects of leverage for Lincoln Company.
4. Rate Earned on Common Stockholders’ Equity
The rate earned on common stockholders’ equity measures the rate of profits earned on the amount invested by the common stockholders. It is computed as follows:
![]()
Because preferred stockholders rank ahead of the common stockholders in their claim on earnings, any preferred dividends are subtracted from net income in computing the rate earned on common stockholders’ equity.
Lincoln Company had $150,000 of 6% preferred stock outstanding on December 31, 2014 and 2013. Thus, preferred dividends of $9,000 ($150,000 x 6%) are deducted from net income. Lincoln’s common stockholders’ equity is determined as follows:
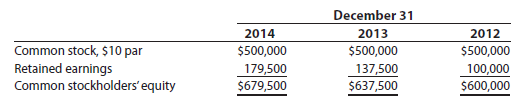
The retained earnings on December 31, 2012, of $100,000 is the same as the retained earnings on January 1, 2013, as shown in Lincoln’s retained earnings statement in Exhibit 4.
Using this information, the rate earned on common stockholders’ equity for Lincoln Company is computed below.
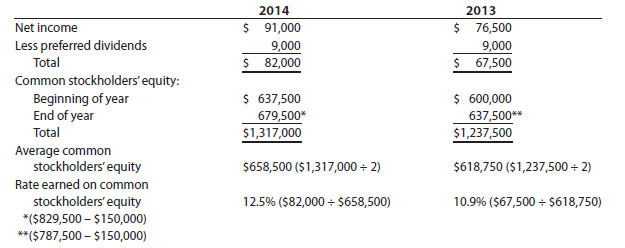
Lincoln Company’s rate earned on common stockholders’ equity improved from 10.9% to 12.5% in 2014. This rate differs from the rates earned by Lincoln Company on total assets and stockholders’ equity as shown below.
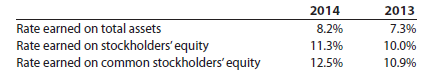
These rates differ because of leverage, as discussed in the preceding section.
5. Earnings per Share on Common Stock
Earnings per share (EPS) on common stock measures the share of profits that are earned by a share of common stock. Earnings per share must be reported in the income statement. As a result, earnings per share (EPS) is often reported in the financial press. It is computed as follows:
![]()
When preferred and common stock are outstanding, preferred dividends are subtracted from net income to determine the income related to the common shares.

To illustrate, the earnings per share (EPS) of common stock for Lincoln Company is computed below.
Lincoln Company had $150,000 of 6% preferred stock outstanding on December 31, 2014 and 2013. Thus, preferred dividends of $9,000 ($150,000 x 6%) are deducted from net income in computing earnings per share on common stock.
Lincoln did not issue any additional shares of common stock in 2014. If Lincoln had issued additional shares in 2014, a weighted average of common shares outstanding during the year would have been used.
Lincoln’s earnings per share (EPS) on common stock improved from $1.35 to $1.64 during 2014.
Lincoln Company has a simple capital structure with only common stock and preferred stock outstanding. Many corporations, however, have complex capital structures with various types of equity securities outstanding, such as convertible preferred stock, stock options, and stock warrants. In such cases, the possible effects of such securities on the shares of common stock outstanding are considered in reporting earnings per share. These possible effects are reported separately as earnings per common share assuming dilution or diluted earnings per share. This topic is described and illustrated in advanced accounting courses and textbooks.
6. Price-Earnings Ratio
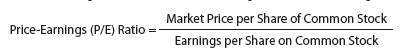
The price-earnings (P/E) ratio on common stock measures a company’s future earnings prospects. It is often quoted in the financial press and is computed as follows:
To illustrate, the price-earnings (P/E) ratio for Lincoln Company is computed below.
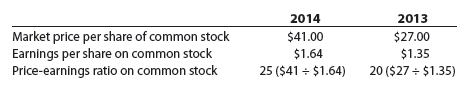
The price-earnings ratio improved from 20 to 25 during 2014. In other words, a share of common stock of Lincoln Company was selling for 20 times earnings per share at the end of 2013. At the end of 2014, the common stock was selling for 25 times earnings per share. This indicates that the market expects Lincoln to experience favorable earnings in the future.
7. Dividends per Share
Dividends per share measures the extent to which earnings are being distributed to common shareholders. It is computed as follows:

To illustrate, the dividends per share for Lincoln Company are computed below.
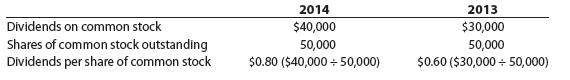
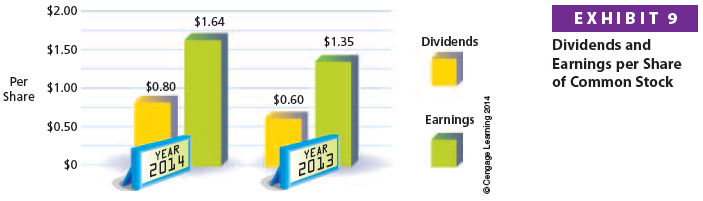
The dividends per share of common stock increased from $0.60 to $0.80 during 2014. Dividends per share are often reported with earnings per share. Comparing the two per-share amounts indicates the extent to which earnings are being retained for use in operations. To illustrate, the dividends and earnings per share for Lincoln Company are shown in Exhibit 9.
8. Dividend Yield
The dividend yield on common stock measures the rate of return to common stockholders from cash dividends. It is of special interest to investors whose objective is to earn revenue (dividends) from their investment. It is computed as follows:
![]() To illustrate, the dividend yield for Lincoln Company is computed below.
To illustrate, the dividend yield for Lincoln Company is computed below.

The dividend yield declined slightly from 2.2% to 2.0% in 2014. This decline was primarily due to the increase in the market price of Lincoln’s common stock.
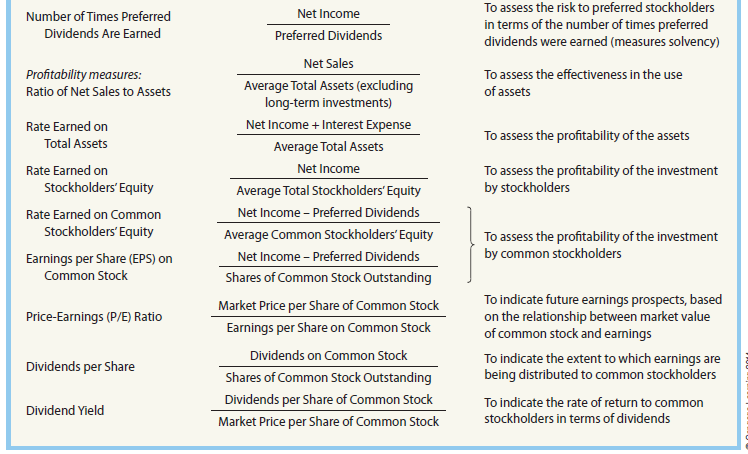
9. Summary of Analytical Measures
Exhibit 10 shows a summary of the solvency and profitability measures discussed in this chapter. The type of industry and the company’s operations usually affect which measures are used. In many cases, additional measures are used for a specific industry. For example, airlines use revenue per passenger mile and cost per available seat as profitability measures. Likewise, hotels use occupancy rates as a profitability measure.
The analytical measures shown in Exhibit 10 are a useful starting point for analyzing a company’s solvency and profitability. However, they are not a substitute for sound judgment. For example, the general economic and business environment should always be considered in analyzing a company’s future prospects. In addition, any trends and interrelationships among the measures should be carefully studied.

Source: Warren Carl S., Reeve James M., Duchac Jonathan (2013), Corporate Financial Accounting, South-Western College Pub; 12th edition.
This piece of writing gives clear idea for the new people of blogging, that genuinely how to do blogging.
Great post! We will be linking to this particularly great
post on our website. Keep up the great writing.
Keep working ,splendid job!