After you have screened your data on both the respondent and variable levels, the next step is to assess the reliability of your indicators to predict the construct of interest.While having a single indicator for a construct might be easy, it does not provide us a lot of confidence in the validity of the response. What if the respondent did not understand the question? Asking multiple questions allows us to see the consistency of response to a construct’s indicators. A good rule of thumb is that having at least three indicators for each construct will allow you to determine the reliability of your items. One of the most popular techniques for assessing reliability with indicators is to calculate Cronbach’s alpha (also called coefficient alpha a). Cronbach’s alpha ranges from 0 to 1, where higher num- bers denote a more reliable scale. This analysis measures the degree to which responses are consistent across the items within a construct (internal consistency). Nunnally and Bernstein (1994) state that an acceptable level of reliability is a Cronbach’s alpha that is greater than .70. Cronbach’s alpha does have some drawbacks that need to be addressed. First, Cronbach’s alpha is inflated when a construct has a large number of indicators, and second, Cronbach’s alpha assumes that all indicators have an equal influence. Even with those drawbacks, it is still the most widely used technique to assess the reliability of a construct’s indicators.
Let’s go back to our example with the three indicators measuring customer delight, and let’s determine the reliability of those indicators to capture delight. To calculate Cronbach’s alpha, you need to go to the SPSS file where your data is located. Next, go to the Menu func- tion “Analyze”, then go to “Scale”, then to “Reliability Analysis”.
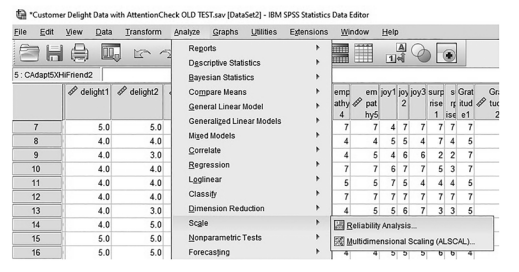
Figure 2.8 Reliability Analysis in SPSS
A pop-up window will appear where you will select your construct’s indicators of interest. In this case, we are going to select all three delight indicators. Make sure the model selection is listed as “Alpha”.
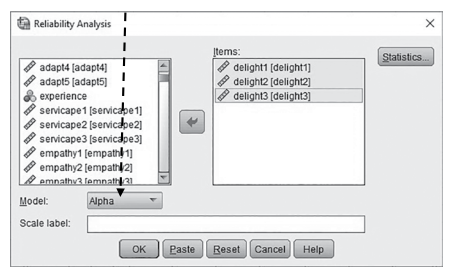
Figure 2.9 Reliability Analysis Pop-Up Window
Next, select the “Statistics” button in the upper right-hand corner. This will let you see numerous details about each indicator. When simply calculating reliability, I usually select only “Item”, “Scale”, and “Scale if item deleted”.The “Scale if item deleted” lets you know how Cronbach’s alpha changes if a specific indicator was deleted from the analysis. After making your selections, select “Continue”, then “OK” on the main reliability analysis screen.
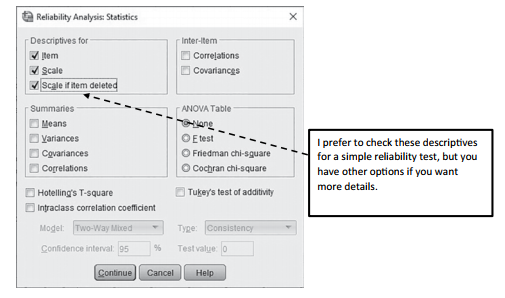
Figure 2.10 Reliability Analysis—Statistics Options
In the output (see Figure 2.11), the Cronbach’s alpha value is .900, which is well above the .70 criteria of acceptable reliability. By including the “Item” statistics in the output, you can see if one indicator has a large standard deviation, which could contribute to unreliability if this is present. Lastly, the “Scale if item deleted” presents the change in Cronbach’s alpha if an item was removed.
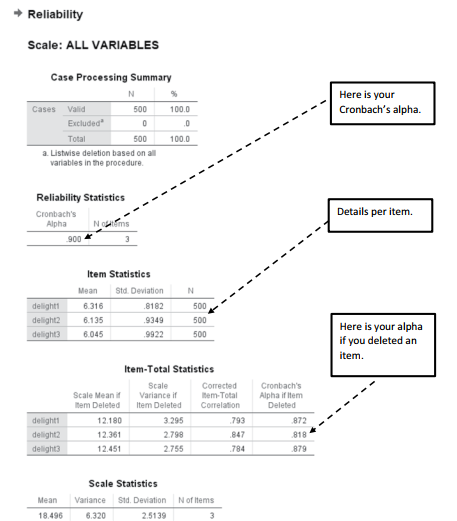
Figure 2.11 Example of Output in SPSS for the Reliability Analysis
Composite Reliability—Another popular reliability analysis is composite reliabil- ity, also called Raykov’s Rho (r). This reliability calculation is based on factor loadings from a confirmatory factor analysis. More details on how to calculate this reliability is presented in Chapter 4 in the confirmatory factor analysis section (page 87). Composite reliability has the same range and cutoff criteria as Cronbach’s alpha for acceptable level of reliability >.70.
In My Opinion: Choosing and Deleting Indicators
I do not like to delete indicators unless there is an obvious problem. Yes, deleting an indicator could raise Cronbach’s alpha levels, but as long as alpha is greater than .70, I am often hesitant to delete an item. Later in the book, I will discuss how validity issues with items can lead to deletion, but having multiple items gives the reader assurance that you have captured the construct from multiple perspectives. In theory, the more items you have, the better your chances of capturing the construct. Saying that, I think some researchers go overboard with the number of items to capture a construct. I have seen some constructs that have more than 20 indicators.This seems like overkill and ultimately leads one to believe that this scale could be refined to still have a comparable level of accuracy with a far smaller number of indicators. I think brand new concepts obviously need a higher number of indicators. Well-established constructs that have been refined can have a much smaller number. At a minimum, you need at least three indicators to calculate Cronbach’s alpha, but the choice on number of indicators should be based on the complexity of the construct.
Source: Thakkar, J.J. (2020). “Procedural Steps in Structural Equation Modelling”. In: Structural Equation Modelling. Studies in Systems, Decision and Control, vol 285. Springer, Singapore.
27 Mar 2023
27 Mar 2023
28 Mar 2023
27 Mar 2023
31 Mar 2023
22 Sep 2022