Users analyze a company’s financial statements using a variety of analytical methods. Three such methods are as follows:
- Horizontal analysis
- Vertical analysis
- Common-sized statements
1. Horizontal Analysis
The percentage analysis of increases and decreases in related items in comparative financial statements is called horizontal analysis. Each item on the most recent statement is compared with the same item on one or more earlier statements in terms of the following:
- Amount of increase or decrease
- Percent of increase or decrease
When comparing statements, the earlier statement is normally used as the base year for computing increases and decreases.
Exhibit 1 illustrates horizontal analysis for the December 31, 2014 and 2013, balance sheets of Lincoln Company. In Exhibit 1, the December 31, 2013, balance sheet (the earliest year presented) is used as the base year.
Exhibit 1 indicates that total assets decreased by $91,000 (7.4%), liabilities decreased by $133,000 (30.0%), and stockholders’ equity increased by $42,000 (5.3%).
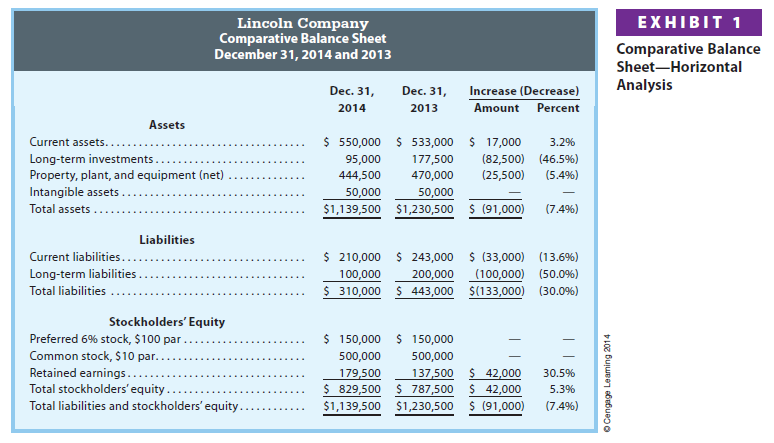
Since the long-term investments account decreased by $82,500, it appears that most of the decrease in long-term liabilities of $100,000 was achieved through the sale of long-term investments.
The balance sheets in Exhibit 1 may be expanded or supported by a separate schedule that includes the individual asset and liability accounts. For example, Exhibit 2 is a supporting schedule of Lincoln’s current asset accounts.
Exhibit 2 indicates that while cash and temporary investments increased, accounts receivable and inventories decreased. The decrease in accounts receivable could be caused by improved collection policies, which would increase cash. The decrease in inventories could be caused by increased sales.
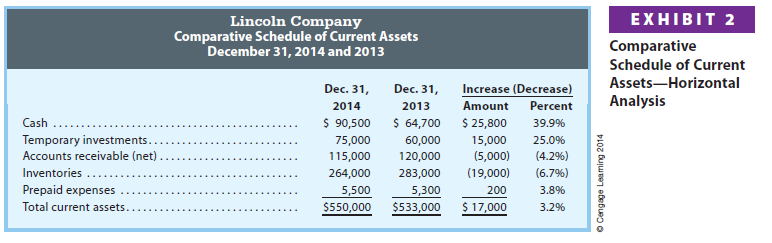
Exhibit 3 illustrates horizontal analysis for the 2014 and 2013 income statements of Lincoln Company. Exhibit 3 indicates an increase in sales of $296,500, or 24.0%. However, the percentage increase in sales of 24.0% was accompanied by an even greater percentage increase in the cost of goods (merchandise) sold of 27.2%.1 Thus, gross profit increased by only 19.7% rather than by the 24.0% increase in sales.
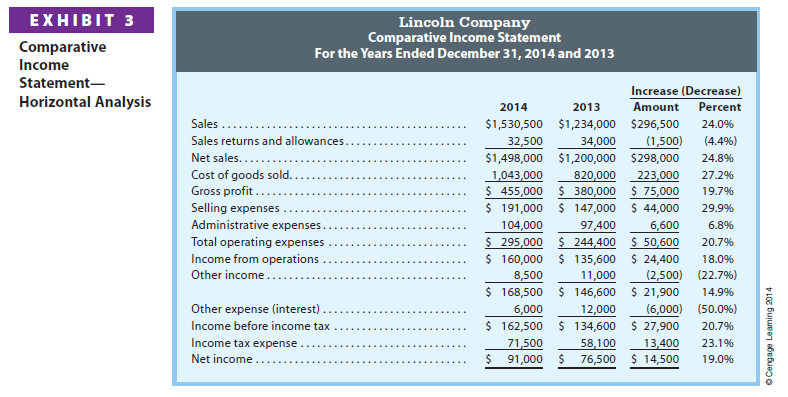
Exhibit 3 also indicates that selling expenses increased by 29.9%. Thus, the 24.0% increases in sales could have been caused by an advertising campaign, which increased selling expenses. Administrative expenses increased by only 6.8%, total operating expenses increased by 20.7%, and income from operations increased by 18.0%. Interest expense decreased by 50.0%. This decrease was probably caused by the 50.0% decrease in long-term liabilities (Exhibit 1). Overall, net income increased by 19.0%, a favorable result.
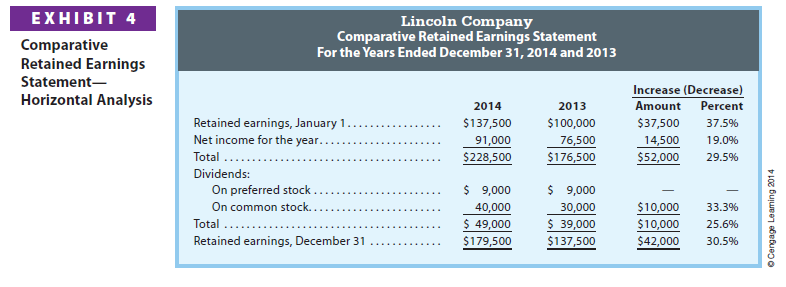
Exhibit 4 illustrates horizontal analysis for the 2014 and 2013 retained earnings statements of Lincoln Company. Exhibit 4 indicates that retained earnings increased by 30.5% for the year. The increase is due to net income of $91,000 for the year, less dividends of $49,000.
2. Vertical Analysis
The percentage analysis of the relationship of each component in a financial statement to a total within the statement is called vertical analysis. Although vertical analysis is applied to a single statement, it may be applied on the same statement over time. This enhances the analysis by showing how the percentages of each item have changed over time.
In vertical analysis of the balance sheet, the percentages are computed as follows:
- Each asset item is stated as a percent of the total assets.
- Each liability and stockholders’ equity item is stated as a percent of the total liabilities and stockholders’ equity.
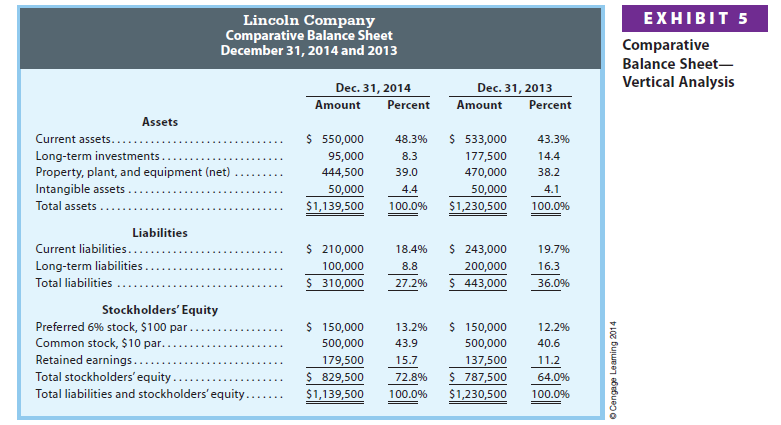
Exhibit 5 illustrates the vertical analysis of the December 31, 2014 and 2013, balance sheets of Lincoln Company. Exhibit 5 indicates that current assets have increased from 43.3% to 48.3% of total assets. Long-term investments decreased from 14.4% to 8.3% of total assets. Stockholders’ equity increased from 64.0% to 72.8%, with a comparable decrease in liabilities.
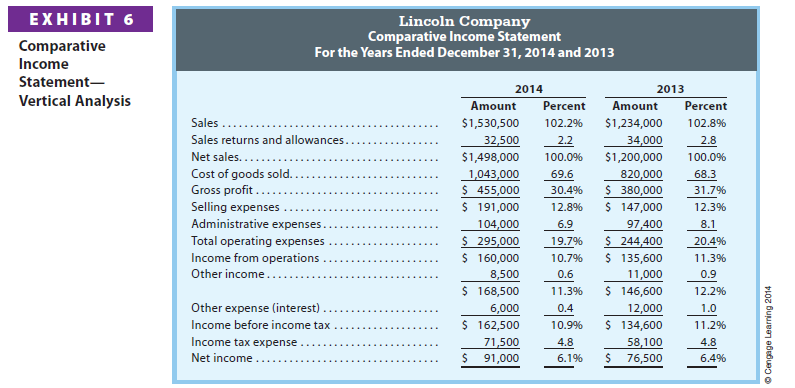
In a vertical analysis of the income statement, each item is stated as a percent of net sales. Exhibit 6 illustrates the vertical analysis of the 2014 and 2013 income statements of Lincoln Company.
Exhibit 6 indicates a decrease in the gross profit rate from 31.7% in 2013 to 30.4% in 2014. Although this is only a 1.3 percentage point (31.7% – 30.4%) decrease, in dollars of potential gross profit, it represents a decrease of $19,500 (1.3% x $1,498,000) based on 2014 net sales. Thus, a small percentage decrease can have a large dollar effect.
3. Common-Sized Statements
In a common-sized statement, all items are expressed as percentages, with no dollar amounts shown. Common-sized statements are often useful for comparing one company with another or for comparing a company with industry averages.
Exhibit 7 illustrates common-sized income statements for Lincoln Company and Madison Corporation. Exhibit 7 indicates that Lincoln Company has a slightly higher rate of gross profit (30.4%) than Madison Corporation (30.0%). However, Lincoln has a higher percentage of selling expenses (12.8%) and administrative expenses (6.9%) than does Madison (11.5% and 4.1%). As a result, the income from operations of Lincoln (10.7%) is less than that of Madison (14.4%).
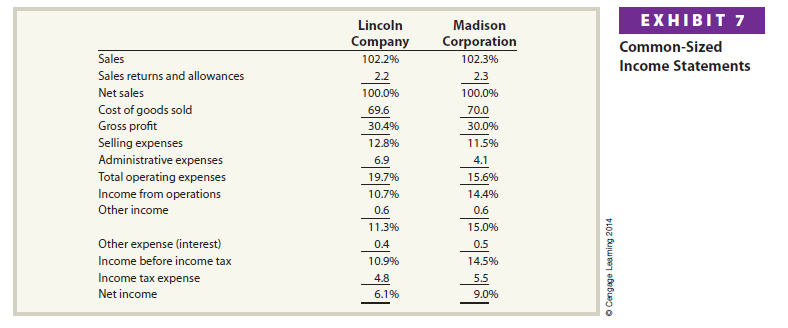
The unfavorable difference of 3.7 (14.4% – 10.7%) percentage points in income from operations would concern the managers and other stakeholders of Lincoln. The underlying causes of the difference should be investigated and possibly corrected. For example, Lincoln Company may decide to outsource some of its administrative duties so that its administrative expenses are more comparative to that of Madison Corporation.
4. Other Analytical Measures
Other relationships may be expressed in ratios and percentages. Often, these relationships are compared within the same statement and, thus, are a type of vertical analysis. Comparing these items with items from earlier periods is a type of horizontal analysis.
Analytical measures are not a definitive conclusion. They are only guides in evaluating financial and operating data. Many other factors, such as trends in the industry and general economic conditions, should also be considered when analyzing a company.
Source: Warren Carl S., Reeve James M., Duchac Jonathan (2013), Corporate Financial Accounting, South-Western College Pub; 12th edition.
Real clear site, thankyou for this post.