Comparing each item in a financial statement with a total amount from the same statement is useful in analyzing relationships within the financial statement. Vertical analysis is the term used to describe such comparisons.
In vertical analysis of a balance sheet, each asset item is stated as a percent of the total assets. Each liability and stockholders’ equity item is stated as a percent of total liabilities and stockholders’ equity. In vertical analysis of an income statement, each item is stated as a percent of revenues or fees earned.
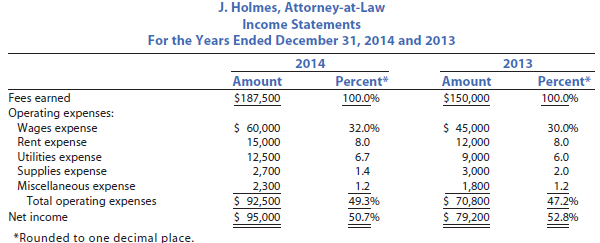
Vertical analysis is also useful for analyzing changes in financial statements over time. To illustrate, a vertical analysis of two years of income statements for J. Holmes, Attorney-at-Law, is shown below.

The preceding vertical analysis indicates both favorable and unfavorable trends affecting the income statement of J. Holmes, Attorney-at-Law. The increase in wages expense of 2% (32.0% – 30.0%) is an unfavorable trend, as is the increase in utilities expense of 0.7% (6.7% – 6.0%). A favorable trend is the decrease in supplies expense of 0.6% (2.0% – 1.4%). Rent expense and miscellaneous expense as a percent of fees earned were constant. The net result of these trends is that net income decreased as a percent of fees earned from 52.8% to 50.7%.
The analysis of the various percentages shown for J. Holmes, Attorney-at-Law, can be enhanced by comparisons with industry averages. Such averages are published by trade associations and financial information services. Any major differences between industry averages should be investigated.
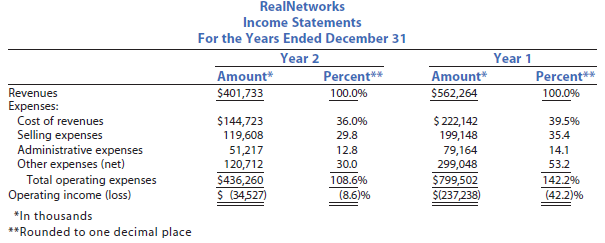
Vertical analysis of operating income taken from two recent years of income statements for RealNetworks is shown below.

The preceding analysis indicates that RealNetworks experienced an operating loss of 8.6% of revenues in Year 2. The analysis indicates that the operating loss decreased significantly in Year 2 from a loss of 42.2% of revenues in Year 1. Each of the expenses as a percent of revenues decreased in Year 2. The largest decrease occurred in the Other expense (net) category, which decreased 23.2% (53.2% – 30.0%). An examination of RealNetworks’ annual report indicates that a large portion of the Other expense in Year 1 was caused by the loss of value of some of its long-term assets due to the depressed world economy in Year 1. Selling expenses decreased from 35.4% of revenues in Year 1 to 29.8% of revenues in Year 2; a 5.6% decrease. Cost of revenues decreased by 3.5% (39.5% – 36.0%) of revenues while Administrative expenses decreased by 1.3% (14.1% – 12.8%) of revenues.
Although RealNetworks still reported a loss in Year 2, it has improved its control of expenses significantly from Year 1. However, the decrease in Revenues from $562,264 to $401,733 is a major concern. Apparently, RealNetworks reduced its expenses in response to its decreasing revenues.
Source: Warren Carl S., Reeve James M., Duchac Jonathan (2013), Corporate Financial Accounting, South-Western College Pub; 12th edition.

I am incessantly thought about this, thanks for putting up.