All users of financial statements are interested in the ability of a company to do the following:
- Maintain liquidity and solvency
- Earn income, called profitability
The ability of a company to convert assets into cash is called liquidity, while the ability of a company to pay its debts is called solvency. Liquidity, solvency, and profitability are interrelated. For example, a company that cannot convert assets into cash may have difficulty taking advantage of profitable courses of action requiring immediate cash outlays. Likewise, a company that cannot pay its debts will have difficulty obtaining credit. A lack of credit will, in turn, limit the company’s ability to purchase merchandise or expand operations, which decreases its profitability.
Liquidity and solvency are normally assessed using the following:
- Current position analysis
- Working capital
- Current ratio
- Quick ratio
- Accounts receivable analysis
-
- Accounts receivable turnover
- Number of days’ sales in receivables
- Inventory analysis
-
- Inventory turnover
- Number of days’ sales in inventory
- The ratio of fixed assets to long-term liabilities
- The ratio of liabilities to stockholders’ equity
- The number of times interest charges are earned
The Lincoln Company financial statements presented earlier are used to illustrate the preceding analyses.
1. Current Position Analysis
A company’s ability to pay its current liabilities is called current position analysis. It is a solvency measure of special interest to short-term creditors and includes the computation and analysis of the following:
- Working capital
- Current ratio
- Quick ratio
Working Capital A company’s working capital is computed as follows:
Working Capital = Current Assets – Current Liabilities
To illustrate, the working capital for Lincoln Company for 2014 and 2013 is computed below.
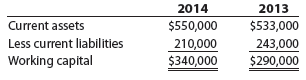
The working capital is used to evaluate a company’s ability to pay current liabilities. A company’s working capital is often monitored monthly, quarterly, or yearly by creditors and other debtors. However, it is difficult to use working capital to compare companies of different sizes. For example, working capital of $250,000 may be adequate for a local hardware store, but it would be inadequate for The Home Depot.
Current Ratio The current ratio, sometimes called the working capital ratio, is computed as follows:
![]()
To illustrate, the current ratio for Lincoln Company is computed below.
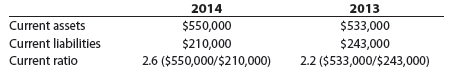
The current ratio is a more reliable indicator of a company’s ability to pay its current liabilities than is working capital, and it is much easier to compare across companies. To illustrate, assume that as of December 31, 2014, the working capital of a competitor is much greater than $340,000, but its current ratio is only 1.3. Considering these facts alone, Lincoln Company, with its current ratio of 2.6, is in a more favorable position to obtain short-term credit than the competitor, which has the greater amount of working capital.
Quick Ratio One limitation of working capital and the current ratio is that they do not consider the types of current assets a company has and how easily they can be turned in to cash. Because of this, two companies may have the same working capital and current ratios, but differ significantly in their ability to pay their current liabilities.
To illustrate, the current assets and liabilities for Lincoln Company and Jefferson Corporation as of December 31, 2014, are as follows:
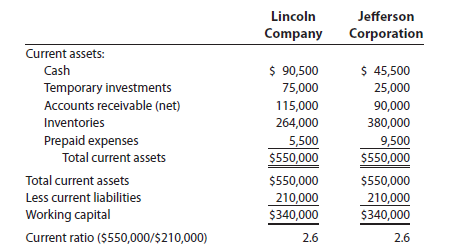
Lincoln and Jefferson both have a working capital of $340,000 and current ratios of 2.6. Jefferson, however, has more of its current assets in inventories. These inventories must be sold and the receivables collected before all the current liabilities can be paid. This takes time. In addition, if the market for its product declines, Jefferson may have difficulty selling its inventory. This, in turn, could impair its ability to pay its current liabilities.
In contrast, Lincoln’s current assets contain more cash, temporary investments, and accounts receivable, which can easily be converted to cash. Thus, Lincoln is in a stronger current position than Jefferson to pay its current liabilities.
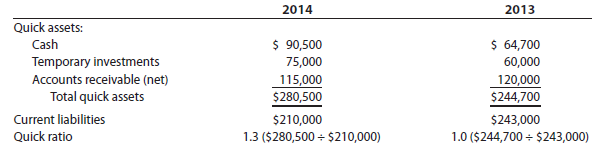
A ratio that measures the “instant” debt-paying ability of a company is the quick ratio, sometimes called the acid-test ratio. The quick ratio is computed as follows:
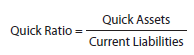
Quick assets are cash and other current assets that can be easily converted to cash. Quick assets normally include cash, temporary investments, and receivables, but exclude inventories and prepaid assets.
To illustrate, the quick ratio for Lincoln Company is computed below.
2. Accounts Receivable Analysis
A company’s ability to collect its accounts receivable is called accounts receivable analysis. It includes the computation and analysis of the following:
- Accounts receivable turnover
- Number of days’ sales in receivables
Collecting accounts receivable as quickly as possible improves a company’s liquidity. In addition, the cash collected from receivables may be used to improve or expand operations. Quick collection of receivables also reduces the risk of uncollectible accounts.
Accounts Receivable Turnover The accounts receivable turnover is computed as follows:
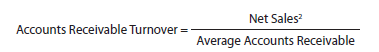
To illustrate, the accounts receivable turnover for Lincoln Company for 2014 and 2013 is computed below. Lincoln’s accounts receivable balance at the beginning of 2013 is $140,000.
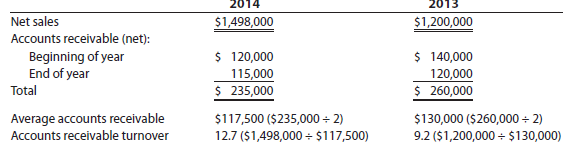
The increase in Lincoln’s accounts receivable turnover from 9.2 to 12.7 indicates that the collection of receivables has improved during 2014. This may be due to a change in how credit is granted, collection practices, or both.
For Lincoln Company, the average accounts receivable was computed using the accounts receivable balance at the beginning and the end of the year. When sales are seasonal and, thus, vary throughout the year, monthly balances of receivables are often used. Also, if sales on account include notes receivable as well as accounts receivable, notes and accounts receivable are normally combined for analysis.
Number of Days’ Sales in Receivables The number of days’ sales in receivables is computed as follows:
![]()
Where
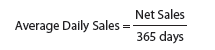
To illustrate, the number of days’ sales in receivables for Lincoln Company is computed below.
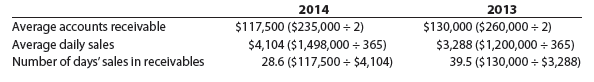
The number of days’ sales in receivables is an estimate of the time (in days) that the accounts receivable have been outstanding. The number of days’ sales in receivables is often compared with a company’s credit terms to evaluate the efficiency of the collection of receivables.
To illustrate, if Lincoln’s credit terms are 2/10, n/30, then Lincoln was very inefficient in collecting receivables in 2013. In other words, receivables should have been collected in 30 days or less, but were being collected in 39.5 days. Although collections improved during 2014 to 28.6 days, there is probably still room for improvement. On the other hand, if Lincoln’s credit terms are n/45, then there is probably little room for improving collections.
3. Inventory Analysis
A company’s ability to manage its inventory effectively is evaluated using inventory analysis. It includes the computation and analysis of the following:
- Inventory turnover
- Number of days’ sales in inventory
Excess inventory decreases liquidity by tying up funds (cash) in inventory. In addition, excess inventory increases insurance expense, property taxes, storage costs, and other related expenses. These expenses further reduce funds that could be used elsewhere to improve or expand operations.
Excess inventory also increases the risk of losses because of price declines or obsolescence of the inventory. On the other hand, a company should keep enough inventory in stock so that it doesn’t lose sales because of lack of inventory.
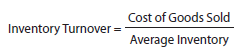
Inventory Turnover The inventory turnover is computed as follows:
To illustrate, the inventory turnover for Lincoln Company for 2014 and 2013 is computed below. Lincoln’s inventory balance at the beginning of 2013 is $311,000.
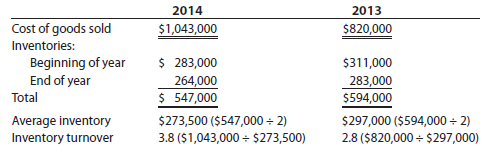
The increase in Lincoln’s inventory turnover from 2.8 to 3.8 indicates that the management of inventory has improved in 2014. The inventory turnover improved because of an increase in the cost of goods sold, which indicates more sales, and a decrease in the average inventories.
What is considered a good inventory turnover varies by type of inventory, companies, and industries. For example, grocery stores have a higher inventory turnover than jewelers or furniture stores. Likewise, within a grocery store, perishable foods have a higher turnover than the soaps and cleansers.
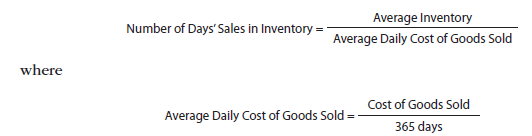
Number of Days’ Sales in Inventory The number of days’ sales in inventory is computed as follows:
To illustrate, the number of days’ sales in inventory for Lincoln Company is computed below.
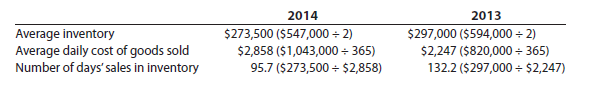
The number of days’ sales in inventory is a rough measure of the length of time it takes to purchase, sell, and replace the inventory. Lincoln’s number of days’ sales in inventory improved from 132.2 days to 95.7 days during 2014. This is a major improvement in managing inventory.
4. Ratio of Fixed Assets to Long-Term Liabilities
The ratio of fixed assets to long-term liabilities provides a measure of whether noteholders or bondholders will be paid. Since fixed assets are often pledged as security for long-term notes and bonds, it is computed as follows:
![]()
To illustrate, the ratio of fixed assets to long-term liabilities for Lincoln Company is computed below.
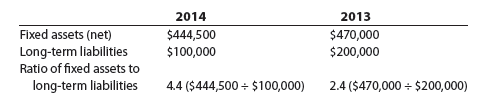
During 2014, Lincoln’s ratio of fixed assets to long-term liabilities increased from 2.4 to 4.4. This increase was due primarily to Lincoln paying off one-half of its longterm liabilities in 2014.
5. Ratio of Liabilities to Stockholders’ Equity
The ratio of liabilities to stockholders’ equity measures how much of the company is financed by debt and equity. It is computed as follows:
![]()
To illustrate, the ratio of liabilities to stockholders’ equity for Lincoln Company is computed below.
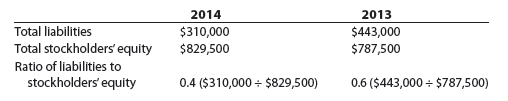
Lincoln’s ratio of liabilities to stockholders’ equity decreased from 0.6 to 0.4 during 2014. This is an improvement and indicates that Lincoln’s creditors have an adequate margin of safety.
6. Number of Times Interest Charges Are Earned
The number of times interest charges are earned, sometimes called the fixed charge coverage ratio, measures the risk that interest payments will not be made if earnings decrease. It is computed as follows:
![]()
Interest expense is paid before income taxes. In other words, interest expense is deducted in determining taxable income and, thus, income tax. For this reason, income before taxes is used in computing the number of times interest charges are earned.
The higher the ratio the more likely interest payments will be paid if earnings decrease. To illustrate, the number of times interest charges are earned for Lincoln Company is computed below.
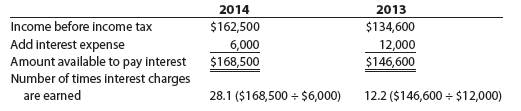
The number of times interest charges are earned improved from 12.2 to 28.1 during 2014. This indicates that Lincoln Company has sufficient earnings to pay interest expense.
The number of times interest charges are earned can be adapted for use with dividends on preferred stock. In this case, the number of times preferred dividends are earned is computed as follows:
![]()
Since dividends are paid after taxes, net income is used in computing the number of times preferred dividends are earned. The higher the ratio, the more likely preferred dividend payments will be paid if earnings decrease.
Source: Warren Carl S., Reeve James M., Duchac Jonathan (2013), Corporate Financial Accounting, South-Western College Pub; 12th edition.
Some genuinely excellent articles on this site, thanks for contribution. “Such evil deeds could religion prompt.” by Lucretius.