We have seen that confidence intervals are powerful tools for making inferences about population parameters. We now consider the ramifications of big data on confidences intervals for means and proportions, and we return to the data-collection problem of online news service PenningtonDailyTimes.com (PDT). Recall that PDT’s primary source of revenue is the sale of advertising, so PDT’s management is concerned about the time customers spend during their visits to PDT’s website and whether visitors click on any of the ads featured on the website.
1. Big Data and the Precision of Confidence Intervals
A review of equations (8.2) and (8.6) shows that confidence intervals for the population mean μ and population proportion p become more narrow as the size of the sample increases. Therefore, the potential sampling error also decreases as the sample size increases. To illustrate the rate at which interval estimates narrow for a given confidence level, we consider the online news service PenningtonDailyTimes.com (PDT).
Prospective advertisers are willing to pay a premium to advertise on websites that have long visit times, so the time customers spend during their visits to PDT’s website has a substantial impact on PDT’s advertising revenues. Suppose PDT’s management wants to develop a 95% confidence interval estimate of the mean amount of time customers spend during their visits to PDT’s website. Table 8.6 shows how the margin of error at the 95% confidence level decreases as the sample size increases when 5 = 20.
Suppose that in addition to estimating the population mean amount of time customers spend during their visits to PDT’s website, PDT would like to develop a 95% confidence interval estimate of the proportion of its website visitors that click on an ad. Table 8.7 shows how the margin of error for a 95% confidence interval estimate of the population proportion decreases as the sample size increases when the sample proportion is p = .51
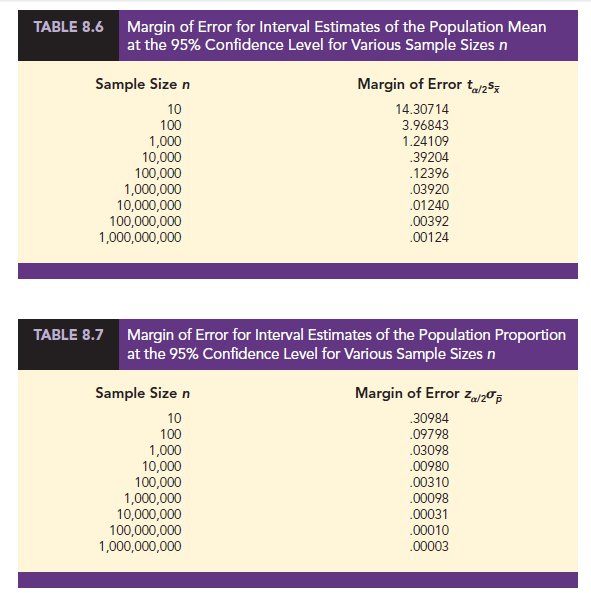
The PDT example illustrates the relationship between the precision of interval estimates and the sample size. We see in Tables 8.6 and 8.7 that at a given confidence level, the margins of error decrease as the sample sizes increase. As a result, if the sample mean time spent by customers when they visit PDT’s website is 84.1 seconds, the 95% confidence interval estimate of the population mean time spent by customers when they visit PDT’s website decreases from (69.79286, 98.40714) for a sample of n = 10 to (83.97604, 84.22396) for a sample of n = 100,000 to (84.09876, 84.10124) for a sample of n = 1,000,000,000. Similarly, if the sample proportion of its website visitors who clicked on an ad is .51, the 95% confidence interval estimate of the population proportion of its website visitors who clicked on an ad decreases from (.20016, .81984) for a sample of n = 10 to (.50690, .51310) for a sample of n = 100,000 to (.50997, .51003) for a sample of n = 1,000,000,000. In both instances, as the sample size becomes extremely large, the margin of error becomes extremely small and the resulting confidence intervals become extremely narrow.
2. Implications of Big Data for Confidence Intervals
Last year the mean time spent by all visitors to PenningtonDailyTimes.com was 84 seconds. Suppose that PDT wants to assess whether the population mean time has changed since last year. PDT now collects a new sample of 1,000,000 visitors to its website and calculates the sample mean time spent by these visitors to the PDT website to be x = 84.1 seconds. The estimated population standard deviation is 5 = 20 seconds, so the standard error is sx = s/ √n = .02000. Furthermore, the sample is sufficiently large to ensure that the sampling distribution of the sample mean will be normally distributed. Thus, the 95% confidence interval estimate of the population mean is
![]()
What could PDT conclude from these results? There are three possible reasons that PDT’s sample mean of 84.1 seconds differs from last year’s population mean of 84 seconds: (1) sampling error, (2) nonsampling error, or (3) the population mean has changed since last year. The 95% confidence interval estimate of the population mean does not include the value for the mean time spent by all visitors to the PDT website for last year (84 seconds), suggesting that the difference between PDT’s sample mean for the new sample (84.1 seconds) and the mean from last year (84 seconds) is not likely to be exclusively a consequence of sampling error. Nonsampling error is a possible explanation and should be investigated as the results of statistical inference become less reliable as nonsampling error is introduced into the sample data. If PDT determines that it introduced little or no nonsampling error into its sample data, the only remaining plausible explanation for a difference of this magnitude is that the population mean has changed since last year.
If PDT concludes that the sample has provided reliable evidence and the population mean has changed since last year, management must still consider the potential impact of the difference between the sample mean and the mean from last year. If a .1 second difference in the time spent by visitors to PenningtonDailyTimes.com has a consequential effect on what PDT can charge for advertising on its site, this result could have practical business implications for PDT. Otherwise, there may be no practical significance of the .1 second difference in the time spent by visitors to PenningtonDailyTimes.com.
Confidence intervals are extremely useful, but as with any other statistical tool, they are only effective when properly applied. Because interval estimates become increasingly precise as the sample size increases, extremely large samples will yield extremely precise estimates. However, no interval estimate, no matter how precise, will accurately reflect the parameter being estimated unless the sample is relatively free of nonsampling error. Therefore, when using interval estimation, it is always important to carefully consider whether a random sample of the population of interest has been taken.
Source: Anderson David R., Sweeney Dennis J., Williams Thomas A. (2019), Statistics for Business & Economics, Cengage Learning; 14th edition.
30 Aug 2021
28 Aug 2021
28 Aug 2021
31 Aug 2021
30 Aug 2021
30 Aug 2021