The simplest form of a price index shows how the current price per unit for a given item compares to a base period price per unit for the same item. For example, Table 20.1 reports the cost of one gallon of gasoline for the years 2000 through 2017. To facilitate comparisons with other years, the actual cost-per-gallon figure can be converted to a price relative, which expresses the unit price in each period as a percentage of the unit price in a base period.
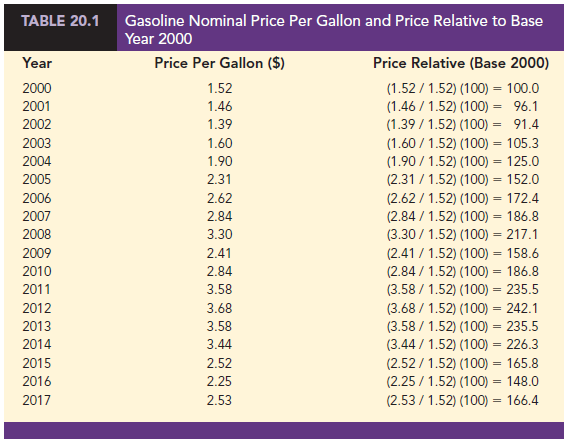
For the gasoline prices in Table 20.1 and with 2000 as the base year, the price relatives for one gallon of gasoline in the years 2000 through 2017 can be calculated. These price relatives are listed in the third column of Table 20.1. Note how easily the price in any one year can be compared with the price in the base year by knowing the price relative. For example, the price relative of 96.1 in 2001 shows that the price of gasoline in 2001 was 3.9% below the 2000 base-year price. Similarly, the 2003 price relative of 105.3 shows a 5.3% increase in the gasoline price in 2003 from the 2000 base-year price. Price relatives, such as the ones for gasoline, are extremely helpful in terms of understanding and interpreting changing economic and business conditions over time.
Source: Anderson David R., Sweeney Dennis J., Williams Thomas A. (2019), Statistics for Business & Economics, Cengage Learning; 14th edition.
30 Aug 2021
30 Aug 2021
31 Aug 2021
30 Aug 2021
28 Aug 2021
28 Aug 2021