So far, we have asked whether individual stocks are “priced right,” given the information that investors can see or acquire. But what about the market as a whole? Are there cases where the overall level of prices cannot be justified by fundamentals? We will look at the evidence in a moment, but first we should note how difficult it is to value common stocks and to determine whether their prices are irrational.
For example, imagine that in mid-2017 you wanted to check whether the stocks forming Standard & Poor’s Composite Index were fairly valued. As a first stab, you might use the constant-growth formula that we introduced in Chapter 4. In 2017, the annual dividends paid by the companies in the index were roughly $420 billion. Suppose that these dividends were expected to grow at a steady rate of 4.0% and that investors required a return of 6.0%. Then the constant-growth formula gives a value for the common stocks of
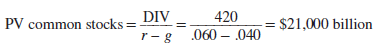
which was roughly their value in August 2017. But how confident could you be about these figures? Perhaps the likely dividend growth was only 3.5% per year. In that case, your estimate of the value of the common stocks would decline to
![]()
In other words, a reduction of just half a percentage point in the expected rate of dividend growth would reduce the value of common stocks by 20%.
The extreme difficulty of valuing common stocks from scratch has two important consequences. First, investors find it easier to price a common stock relative to yesterday’s price or relative to today’s price of similar securities. In other words, they generally take yesterday’s price as correct, adjusting upward or downward on the basis of today’s information. If information arrives smoothly, then, as time passes, investors become increasingly confident that today’s price level is correct. But when investors lose confidence in the benchmark of yesterday’s price, there may be a period of confused trading and volatile prices before a new benchmark is established.
Second, most of the tests of market efficiency are concerned with relative prices and focus on whether there are easy profits to be made. It is almost impossible to test whether stocks are correctly valued because no one can measure true value with any precision. Take, for example, Pepsi stock, which sold for $116 July 2018. Could we prove that this was its true value? Of course not, but we could be more confident that the price of Pepsi should be somewhat more than double that of Coca-Cola ($45) because Pepsi’s earnings and dividends per share were 2.5 times those of Coke and the two companies had similar growth prospects.
It may be impossible to prove that market levels are, or are not, consistent with fundamentals. However, every now and again investors seem to be caught up in a speculative frenzy, and asset prices then reach levels that (at least with hindsight) cannot easily be justified by the outlook for profits and dividends. Investors refer to such occasions as bubbles. Bubbles can result when prices rise rapidly, and more and more investors join the game on the assumption that prices will continue to rise. These bubbles can be self-sustaining for a while. It can be rational to jump on the bandwagon as long as you are sure that there will be greater fools that you can sell out to. But remember that lots of money will be lost, perhaps by you, when the bubble bursts.[1]
The Japanese bubble is a good example. The Nikkei 225 Index increased by about 240% from the start of 1985 to its peak of about 39,000 in January 1990. But stock prices fell sharply after an increase in interest rates. The Nikkei fell to about 23,000 by year-end 1990 and continued an irregular slide downward to about 10,000 in 2010. The index has since recovered, but only to 23,000 in early 2018.
The boom in Japanese stock prices was matched by an even greater explosion in land prices. For example, Ziemba and Schwartz document that the few hundred acres of land under the Emperor’s Palace in Tokyo, evaluated at neighborhood land prices, was worth as much as all the land in Canada or California.[2] But then the real estate bubble also burst. By 2005, land prices in the six major Japanese cities had slumped to just 13% of their peak.
Such bubbles are not confined to Japan. Toward the end of the twentieth century, investors in technology stocks saw a remarkable run-up in the value of their holdings. The Nasdaq Composite Index, which has a heavy weighting in high-tech stocks, rose 580% from the start of 1995 to its high in 2000. Then, as rapidly as it began, the boom ended, and by October 2002 the Nasdaq index had fallen 78% from its peak.
Some of the largest gains and losses were experienced by dot-com stocks. For example, Yahoo! shares, which began trading in April 1996, appreciated by 1,400% in four years. In these heady days, some companies found that they could boost their stock price simply by adding “.com” to the company name.[3]
Looking back at the Japanese and dot-com bubbles, it seems difficult to believe that future cash flows could ever have been sufficient to provide investors with a reasonable return.[4] If that is the case, then we must conclude that “bubbles happen.” When they do happen, markets cannot be efficient.
certainly like your website but you need to check the spelling on quite a few of your posts. Many of them are rife with spelling problems and I find it very troublesome to tell the truth nevertheless I will certainly come back again.