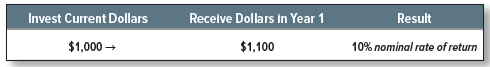
It is now time to review more carefully the relation between inflation and interest rates. Suppose you invest $1,000 in a one-year bond that makes a single payment of $1,100 at the end of the year. Your cash flow is certain, but the government makes no promises about what that money will buy. If the prices of goods and services increase by more than 10%, you will lose ground in terms of purchasing power.
Several indexes are used to track the general level of prices. The best known is the consumer price index (CPI), which measures the number of dollars that it takes to pay for a typical family’s purchases. The change in the CPI from one year to the next measures the rate
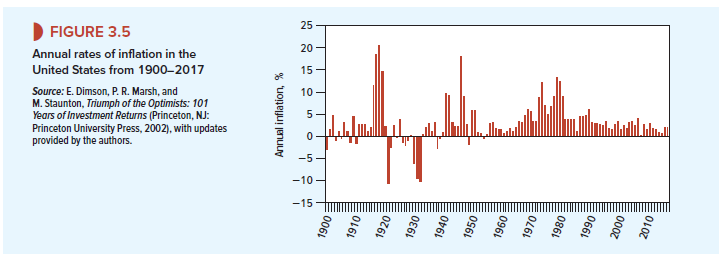
Figure 3.5 shows the rate of inflation in the U.S. since 1900. Inflation touched a peak at the end of World War I, when it reached 21%. However, this figure pales into insignificance compared with the hyperinflation in Zimbabwe in 2008. Prices there rose so fast that a Z$50 trillion bill was barely enough to buy a loaf of bread.
Prices can fall as well as rise. The U.S. experienced severe deflation in the Great Depression, when prices fell by 24% in three years. In Japan, which has experienced persistent deflation, prices in 2017 were only marginally higher than they had been 20 years earlier.
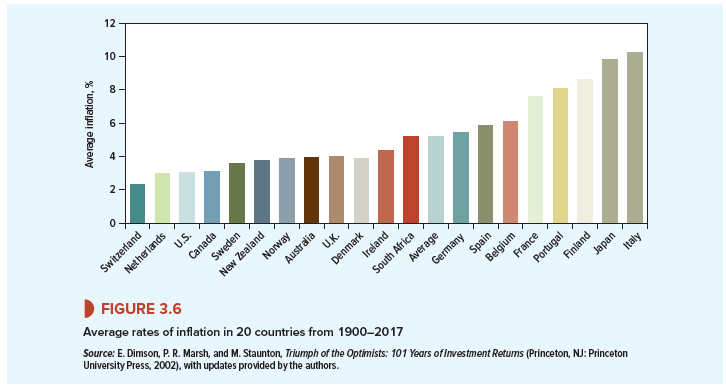
The average U.S. inflation rate from 1900 to 2017 was 3.0%. As you can see from Figure 3.6, among major economies, the United States has been almost top of the class in holding inflation in check. Countries torn by war have generally experienced much higher inflation. For example, in Italy and Japan, inflation since 1900 has averaged around 10% a year.
Economists and financial managers refer to current, or nominal, dollars versus constant, or real, dollars. For example, the nominal cash flow from your one-year bond is $1,100. But if prices rise over the year by 6%, then each dollar will buy you 6% less next year than it does today. So at the end of the year, $1,100 has the same purchasing power as 1,100/1.06 = $1,037.74 today. The nominal payoff on the bond is $1,100, but the real payoff is only $1,037.74.
The formula for converting nominal cash flows in a future period t to real cash flows today is
For example, suppose you invest in a 20-year Treasury strip, but prices over that period grow by 6% per year. The strip pays $1,000 in year 20, but the real value of that payoff is only 1,000/1.0620 = $311.80. In this example, the purchasing power of $1 today declines to just over $.31 after 20 years.
These examples show you how to get from nominal to real cash flows. The journey from nominal to real interest rates is similar. When a bond dealer says that your bond yields 10%, she is quoting a nominal interest rate. That rate tells you how rapidly your money will grow— say, over one year:
However, with an expected inflation rate of 6%, you are only 3.774% better off at the end of the year than at the start:
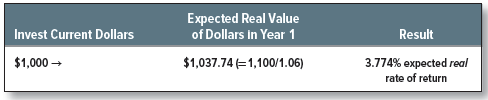
Thus, we could say, “The bond offers a 10% nominal rate of return,” or “It offers a 3.774% expected real rate of return.”
The formula for calculating the real rate of return is:
![]()
In our example, 1 + rreal = 1.10/1.06 = 1.03774. A common rule of thumb states that rreal = rnominal – inflation rate. In our example, this gives rreal = .10 – .06 = .04, or 4%. This is not a bad approximation to the true real interest rate of 3.774%. But when inflation is high, it pays to use the full formula.
1. Indexed Bonds and the Real Rate of Interest
Most bonds are like our U.S. Treasury bonds; they promise you a fixed nominal rate of interest. The real interest rate that you receive is uncertain and depends on inflation. If the inflation rate turns out to be higher than you expected, the real return on your bonds will be lower.
You can nail down a real return, however. You do so by buying an indexed bond that makes cash payments linked to inflation. Indexed bonds have been around in many other countries for decades, but they were almost unknown in the United States until 1997, when the U.S. Treasury began to issue inflation-indexed bonds known as TIPS (Treasury Inflation-Protected Securities).[1]
The real cash flows on TIPS are fixed, but the nominal cash flows (interest and principal) increase as the CPI increases.[2] For example, suppose that the U.S. Treasury issues 3% 20-year TIPS at a price equal to its face value of $1,000. If during the first year the CPI rises by 10%, then the coupon payment on the bond increases by 10% from $30 to 30 X 1.10 = $33. The amount that you will be paid at maturity also increases to $1,000 X 1.10 = $1,100. The purchasing power of the coupon and face value remain constant at $33/1.10 = $30 and $1,100/1.10 = $1,000. Thus, an investor who buys the bond at the issue price earns a surefire real interest rate of 3%.
Long-term TIPS offered a yield of about .5% in December 2017.[3] This is a real yield to maturity. It measures the extra goods and services your investment will allow you to buy. The .5% yield on TIPS was about 1.9% less than the nominal yield on ordinary Treasury bonds. If the annual inflation rate turns out to be higher than 1.9%, investors will earn a higher return by holding long-term TIPS; if the inflation rate turns out to be less than 1.9%, they would have been better off with nominal bonds.
2. What Determines the Real Rate of Interest?
The real rate of interest depends on people’s willingness to save (the supply of capital)[4] and the opportunities for productive investment by governments and businesses (the demand for capital). For example, suppose that investment opportunities generally improve. Firms have more good projects, so they are willing to invest more than previously at the current real interest rate. Therefore, the rate has to rise to induce individuals to save the additional amount that firms want to invest.[5] Conversely, if investment opportunities deteriorate, there will be a fall in the real interest rate.
Short- and medium-term real interest rates are affected by the monetary policy of central banks. For example, sometimes central banks keep short-term nominal interest rates low despite significant inflation. The resulting real rates can be negative. However, nominal i nterest rates cannot be negative except in fairly rare circumstances because investors can simply hold cash. Cash always pays zero interest, which is better than negative interest.
For many years, real interest rates were much more stable than nominal rates, but as you can see from Figure 3.7, both nominal and real interest rates have plummeted since the financial crash.

3. Inflation and Nominal Interest Rates
How does the inflation outlook affect the nominal rate of interest? Here is how economist Irving Fisher answered the question. Suppose that consumers are equally happy with 100 apples today or 103 apples in a year’s time. In this case, the real or “apple” interest rate is 3%. If the price of apples is constant at (say) $1 each, then we will be equally happy to receive $100 today or $103 at the end of the year. That extra $3 will allow us to buy 3% more apples at the end of the year than we could buy today.
But suppose now that the apple price is expected to increase by 5% to $1.05 each. In that case, we would not be happy to give up $100 today for the promise of $103 next year. To buy 103 apples in a year’s time, we will need to receive 1.05 x $103 = $108.15. In other words, the nominal rate of interest must increase by the expected rate of inflation to 8.15%.
This is Fisher’s theory: A change in the expected inflation rate causes the same proportionate change in the nominal interest rate; it has no effect on the required real interest rate. The formula relating the nominal interest rate and expected inflation is
![]()
where rreal is the real interest rate that consumers require and i is the expected inflation rate. In our example, the prospect of inflation causes 1 + rnominal to rise to 1.03 x 1.05 = 1.0815.
Not all economists would agree with Fisher that the real rate of interest is unaffected by the inflation rate. For example, if changes in prices are associated with changes in the level of industrial activity, then in inflationary conditions I might want more or less than 103 apples in a year’s time to compensate me for the loss of 100 today.
We wish we could show you the past behavior of interest rates and expected inflation. Instead, we have done the next best thing and plotted in Figure 3.8 the return on Treasury bills (short-term government debt) against actual inflation for the United States, U.K., and Germany. Notice that since 1953, the return on Treasury bills has generally been a little above the rate of inflation. Investors in each country earned an average real return of between 1% and 2% during this period.
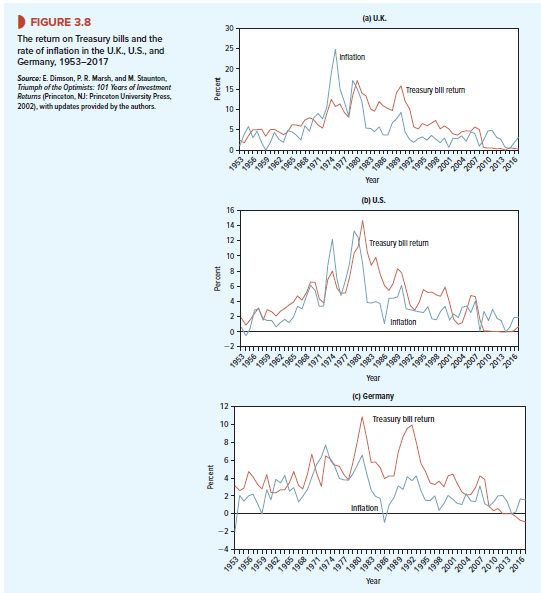
Look now at the relationship between the rate of inflation and the Treasury bill rate. Figure 3.8 shows that investors have for the most part demanded a higher rate of interest when inflation was high. So it looks as if Fisher’s theory provides a useful rule of thumb for financial managers. If the expected inflation rate changes, it is a good bet that there will be a corresponding change in the nominal interest rate. In other words, a strategy of rolling over short-term investments affords some protection against uncertain inflation.
What’s up mates, how is the whole thing, and what you wish for to say on the topic of this
article, in my view its truly remarkable in favor of me.
Hi, Neat post. There’s a problem along with your website in internet explorer, could test this?K IE still is the market chief and a good portion of folks will miss your magnificent writing due to this problem.
This website is my breathing in, very good layout and perfect articles.