This brings us to our next major takeaway: The risk of a well-diversified portfolio depends on the market risk of the securities included in the portfolio. Tattoo that statement on your forehead if you can’t remember it any other way. It is one of the most important ideas in this book.
1. Market Risk Is Measured by Beta
If you want to know the contribution of an individual security to the risk of a well-diversified portfolio, it is no good thinking about how risky that security is if held in isolation—you need to measure its market risk, and that boils down to measuring how sensitive it is to market movements. This sensitivity is called beta (P).
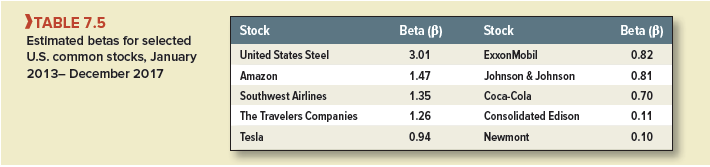
Stocks with betas greater than 1.0 tend to amplify the overall movements of the market. Stocks with betas between 0 and 1.0 tend to move in the same direction as the market, but not as far. Of course, the market is the portfolio of all stocks, so the “average” stock has a beta of 1.0. Table 7.5 reports betas for the 10 well-known common stocks we referred to earlier.
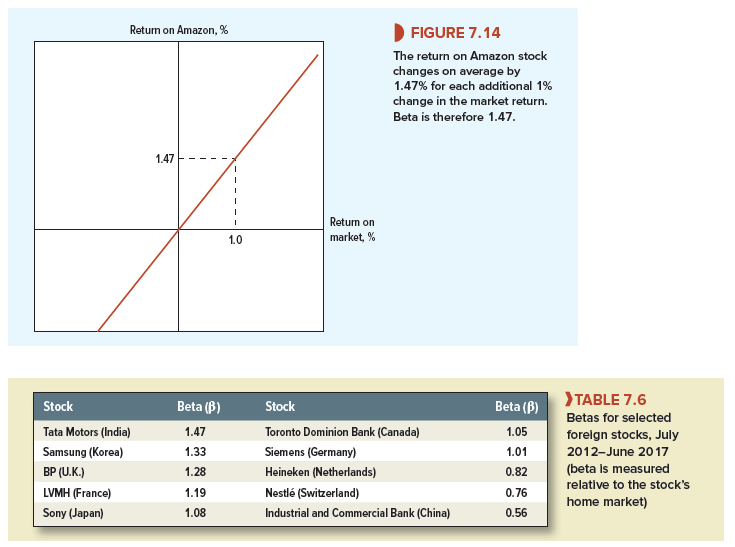
Over the five years from January 2013 to December 2017, Amazon had a beta of 1.47. If the future resembles the past, this means that on average, when the market rises an extra 1%, Amazon’s stock price will rise by an extra 1.47%. When the market falls an extra 2%, Amazon’s stock price will fall, on average, an extra 2 x 1.47 = 2.94%. Thus, a line fitted to a plot of Amazon’s returns versus market returns has a slope of 1.47. See Figure 7.14.
Of course, Amazon’s stock returns are not perfectly correlated with market returns. The company is also subject to specific risk, so the actual returns will be scattered about the line in Figure 7.14. Sometimes, Amazon will head south while the market goes north, and vice versa.
Of the 10 stocks in Table 7.5, U.S. Steel has the highest beta. Newmont Mining is at the other extreme. A line fitted to a plot of Newmont’s returns versus market returns would be less steep: Its slope would be only .10. Notice that many of the stocks that have high standard deviations also have high betas. But that is not always so. For example, Newmont, which has a relatively high standard deviation, is a leading member of the low-beta club in the right-hand column of Table 7.5. It seems that while Newmont is a risky investment if held on its own, it does not contribute to the risk of a diversified portfolio.
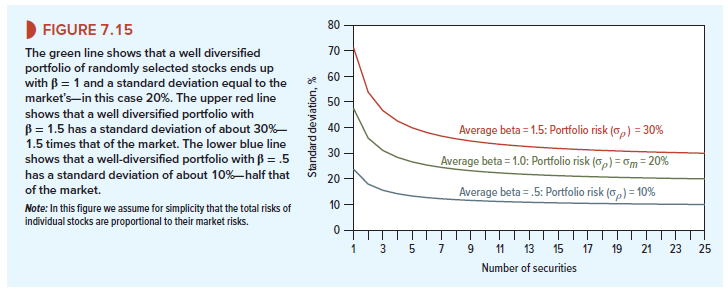
Just as we can measure how the returns of a U.S. stock are affected by fluctuations in the U.S. market, so we can measure how stocks in other countries are affected by movements in their markets. Table 7.6 shows the betas for the sample of stocks from other countries.
2. Why Security Betas Determine Portfolio Risk
Let us review the two crucial points about security risk and portfolio risk:
- Market risk accounts for most of the risk of a well-diversified portfolio.
- The beta of an individual security measures its sensitivity to market movements.
It is easy to see where we are headed: In a portfolio context, a security’s risk is measured by beta. Perhaps we could just jump to that conclusion, but we would rather explain it. Here is an intuitive explanation. We provide a more technical one in footnote 29.
Where’s Bedrock? Look again at Figure 7.11, which shows how the standard deviation of portfolio return depends on the number of securities in the portfolio. With more securities, and therefore better diversification, portfolio risk declines until all specific risk is eliminated and only the bedrock of market risk remains.
Where’s bedrock? It depends on the average beta of the securities selected.
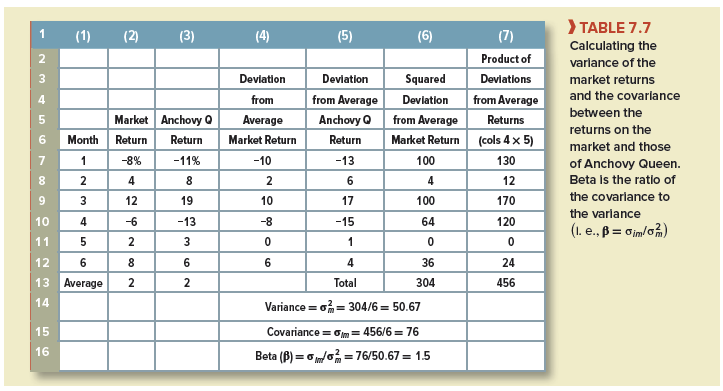
Suppose we constructed a portfolio containing a large number of stocks—500, say—drawn randomly from the whole market. What would we get? The market itself, or a portfolio very close to it. The portfolio beta would be 1.0, and the correlation with the market would be 1.0. If the standard deviation of the market were 20% (roughly its average for 1900-2017), then the portfolio standard deviation would also be 20%. This is shown by the green line in Figure 7.15.
But suppose we constructed the portfolio from a large group of stocks with an average beta of 1.5. Again we would end up with a 500-stock portfolio with virtually no specific risk—a portfolio that moves almost in lockstep with the market. However, this portfolio’s standard deviation would be 30%, 1.5 times that of the market.[1] A well-diversified portfolio with a beta of 1.5 will amplify every market move by 50% and end up with 150% of the market’s risk. The upper red line in Figure 7.15 shows this case.
Of course, we could repeat the same experiment with stocks with a beta of .5 and end up with a well-diversified portfolio half as risky as the market. You can see this also in Figure 7.15.
The general point is this: The risk of a well-diversified portfolio is proportional to the portfolio beta, which equals the average beta of the securities included in the portfolio. This shows you how portfolio risk is driven by security betas.
Calculating Beta A statistician would define the beta of stock i as
![]()
where σim is the covariance between the stock returns and the market returns and σ 2m is the variance of the returns on the market. It turns out that this ratio of covariance to variance measures a stock’s contribution to portfolio risk.
Here is a simple example of how to do the calculations. Columns 2 and 3 in Table 7.7 show the returns over a particular six-month period on the market and the stock of the Anchovy Queen restaurant chain. You can see that, although both investments provided an average return of 2%, Anchovy Queen’s stock was particularly sensitive to market movements, rising more when the market rises and falling more when the market falls.
Columns 4 and 5 show the deviations of each month’s return from the average. To calculate the market variance, we need to average the squared deviations of the market returns (column 6). And to calculate the covariance between the stock returns and the market, we need to average the product of the two deviations (column 7). Beta is the ratio of the covariance to the market variance, or 76/50.67 = 1.50. A diversified portfolio of stocks with the same beta as Anchovy Queen would be one-and-a-half times as volatile as the market.
Simply a smiling visitor here to share the love (:, btw outstanding style and design.