Producers in a cartel explicitly agree to cooperate in setting prices and output levels. Not all the producers in an industry need to join the cartel, and most cartels involve only a subset of producers. But if enough producers adhere to the cartel’s agreements, and if market demand is sufficiently inelastic, the cartel may drive prices well above competitive levels.
Cartels are often international. While U.S. antitrust laws prohibit American companies from colluding, those of other countries are much weaker and are sometimes poorly enforced. Furthermore, nothing prevents countries, or companies owned or controlled by foreign governments, from forming cartels. For example, the OPEC cartel is an international agreement among oil-producing countries which has succeeded in raising world oil prices above competitive levels.
Other international cartels have also succeeded in raising prices. During the mid-1970s, for example, the International Bauxite Association (IBA) quadrupled bauxite prices, and a secretive international uranium cartel pushed up uranium prices. Some cartels had longer successes: From 1928 through the early 1970s, a cartel called Mercurio Europeo kept the price of mercury close to monopoly levels, and an international cartel monopolized the iodine market from 1878 through 1939. However, most cartels have failed to raise prices. An international copper cartel operates to this day, but it has never had a significant impact on copper prices. Cartel attempts to drive up the prices of tin, coffee, tea, and cocoa have also failed.
CONDITIONS FOR CARTEL SUCCESS Why do some cartels succeed while others fail? There are two conditions for cartel success. First, a stable cartel organization must be formed whose members agree on price and production levels and then adhere to that agreement. Unlike our prisoners in the prison- ers’ dilemma, cartel members can talk to each other to formalize an agreement. This does not mean, however, that agreeing is easy. Different members may have different costs, different assessments of market demand, and even dif- ferent objectives, and they may therefore want to set price at different levels. Furthermore, each member of the cartel will be tempted to “cheat” by lowering its price slightly to capture a larger market share than it was allotted. Most often, only the threat of a long-term return to competitive prices deters cheating of this sort. But if the profits from cartelization are large enough, that threat may be sufficient.
The second condition is the potential for monopoly power. Even if a cartel can solve its organizational problems, there will be little room to raise price if it faces a highly elastic demand curve. Potential monopoly power may be the most important condition for success; if the potential gains from cooperation are large, cartel members will have more incentive to solve their organizational problems.
1. Analysis of Cartel Pricing
Only rarely do all the producers of a good combine to form a cartel. A cartel usually accounts for only a portion of total production and must take into account the supply response of competitive (noncartel) producers when it sets price. Cartel pricing can thus be analyzed by using the dominant firm model discussed earlier. We will apply this model to two cartels, the OPEC oil cartel and the CIPEC copper cartel.13 This will help us understand why OPEC was suc- cessful in raising price while CIPEC was not.
ANALYZING OPEC Figure 12.10 illustrates the case of OPEC. Total demand TD is the total world demand curve for crude oil, and Sc is the competitive (non-OPEC) supply curve. The demand for OPEC oil DOPEC is the difference between total demand and competitive supply, and MROPEC is the corresponding marginal revenue curve. MCOPEC is OPEC’s marginal cost curve; as you can see, OPEC has much lower production costs than do non-OPEC producers. OPEC’s marginal revenue and marginal cost are equal at quantity QOPEC, which is the quantity that OPEC will produce. We see from OPEC’s demand curve that the price will be P*, at which competitive supply is Qc.
Suppose petroleum-exporting countries had not formed a cartel but had instead produced competitively. Price would then have equaled marginal cost. We can therefore determine the competitive price from the point where OPEC’s demand curve intersects its marginal cost curve. That price, labeled Pc, is much lower than the cartel price P*. Because both total demand and non-OPEC sup- ply are inelastic, the demand for OPEC oil is also fairly inelastic. Thus the cartel has substantial monopoly power, and it has used that power to drive prices well above competitive levels.
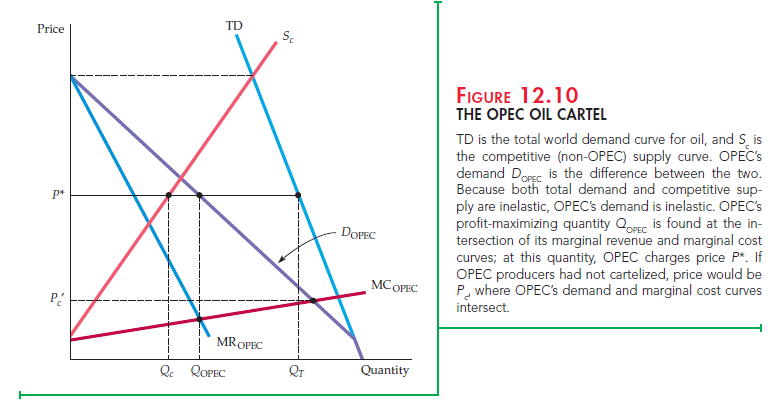
In Chapter 2, we stressed the importance of distinguishing between short-run and long-run supply and demand. That distinction is important here. The total demand and non-OPEC supply curves in Figure 12.10 apply to a short- or inter- mediate-run analysis. In the long run, both demand and supply will be much more elastic, which means that OPEC’s demand curve will also be much more elastic. We would thus expect that in the long run OPEC would be unable to maintain a price that is so much above the competitive level. Indeed, during 1982–1989, oil prices fell in real terms, largely because of the long-run adjust- ment of demand and non-OPEC supply.
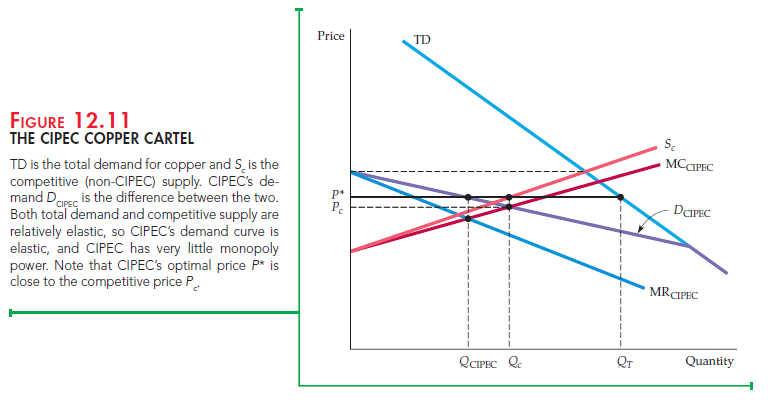
ANALYZING CIPEC Figure 12.11 provides a similar analysis of CIPEC, which consists of four copper-producing countries: Chile, Peru, Zambia, and Congo (formerly Zaire), that collectively account for less than half of world copper production. In these countries, production costs are lower than those of non-CIPEC producers, but except for Chile, not much lower. In Figure 12.11, CIPEC’s marginal cost curve is therefore drawn only a little below the non-CIPEC supply curve. CIPEC’s demand curve DCIPEC is the differ-ence between total demand TD and non-CIPEC supply Sc. CIPEC’s marginal cost and marginal revenue curves intersect at quantity QCIPEC, with the corre-sponding price P*. Again, the competitive price Pc is found at the point where CIPEC’s demand curve intersects its marginal cost curve. Note that this price is very close to the cartel price P*.
Why can’t CIPEC increase copper prices much? As Figure 12.11 shows, the total demand for copper is more elastic than that for oil. (Other materials, such as aluminum, can easily be substituted for copper.) Also, competitive supply is much more elastic. Even in the short run, non-CIPEC producers can easily expand supply if prices should rise (in part because of the availability of supply from scrap metal). Thus CIPEC’s potential monopoly power is small.
As the examples of OPEC and CIPEC illustrate, successful cartelization requires two things. First, the total demand for the good must not be very price elastic. Second, either the cartel must control nearly all the world’s supply or, if it does not, the supply of noncartel producers must not be price elastic. Most international commodity cartels have failed because few world markets meet both conditions.
Source: Pindyck Robert, Rubinfeld Daniel (2012), Microeconomics, Pearson, 8th edition.
Great web site. Lots of helpful info here. I am sendimg iit to somee buddies ans additionally sharing in delicious.
And obviously, thank you in yoyr sweat!
Nice post. I was checking continuously this blog and I’m impressed!
Very useful info particularly the last part
I care for
such info much. I was seeking this particular info for
a long time. Thank you and good luck.
Actually great writing, I wish I can see many more blog articles like this!
Wonderful article! This is the kind of info that should be shared across the web.
Shame on the seek engines for no longer positioning this submit upper!
Come on over and seek advice from my website . Thank
you =)