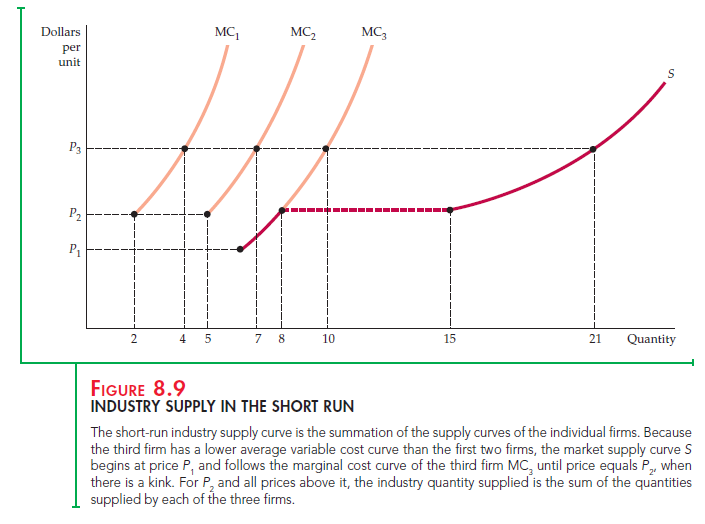
The short-run market supply curve shows the amount of output that the industry will produce in the short run for every possible price. The indus- try’s output is the sum of the quantities supplied by all of its individual firms. Therefore, the market supply curve can be obtained by adding the supply curves of each of these firms. Figure 8.9 shows how this is done when there are only three firms, all of which have different short-run pro- duction costs. Each firm’s marginal cost curve is drawn only for the portion that lies above its average variable cost curve. (We have shown only three firms to keep the graph simple, but the same analysis applies when there are many firms.)
At any price below P1, the industry will produce no output because P1 is the minimum average variable cost of the lowest-cost firm. Between P1 and P2, only firm 3 will produce. The industry supply curve, therefore, will be identical to that portion of firm 3’s marginal cost curve MC3. At price P2, the industry sup- ply will be the sum of the quantity supplied by all three firms. Firm 1 supplies 2 units, firm 2 supplies 5 units, and firm 3 supplies 8 units. Industry supply is thus 15 units. At price P3, firm 1 supplies 4 units, firm 2 supplies 7 units, and firm 3 supplies 10 units; the industry supplies 21 units. Note that the industry supply curve is upward sloping but has a kink at price P2, the lowest price at which all three firms produce. With many firms in the market, however, the kink becomes unimportant. Thus we usually draw industry supply as a smooth, upward-sloping curve.
Elasticity of Market Supply
Unfortunately, finding the industry supply curve is not always as simple as add- ing up a set of individual supply curves. As price rises, all firms in the industry expand their output. This additional output increases the demand for inputs to production and may lead to higher input prices. As we saw in Figure 8.7, increasing input prices shifts a firm’s marginal cost curve upward. For example, an increased demand for beef could also increase demand for corn and soybeans (which are used to feed cattle) and thereby cause the prices of these crops to rise. In turn, higher input prices will cause firms’ marginal cost curves to shift upward. This increase lowers each firm’s output choice (for any given market price) and causes the industry supply curve to be less responsive to changes in output price than it would otherwise be.
The price elasticity of market supply measures the sensitivity of industry output to market price. The elasticity of supply Es is the percentage change in quantity supplied Q in response to a 1-percent change in price P:
![]()
Because marginal cost curves are upward sloping, the short-run elasticity of supply is always positive. When marginal cost increases rapidly in response to increases in output, the elasticity of supply is low. In the short run, firms are capacity-constrained and find it costly to increase output. But when marginal cost increases slowly in response to increases in output, supply is relatively elas- tic; in this case, a small price increase induces firms to produce much more.
At one extreme is the case of perfectly inelastic supply, which arises when the indus- try’s plant and equipment are so fully utilized that greater output can be achieved only if new plants are built (as they will be in the long run). At the other extreme is the case of perfectly elastic supply, which arises when marginal cost is constant.
Source: Pindyck Robert, Rubinfeld Daniel (2012), Microeconomics, Pearson, 8th edition.
Wonderful site. Plenty of useful info here. I am sending it to a few friends ans also sharing in delicious. And of course, thanks for your effort!