Japanese Cloud charts are a relatively new method of interpreting price data. They use calculations similar to Western charts such as moving averages, but they also use such calculations as ranges and areas between plotted lines. While the charts themselves are easily read by Westerners, their interpretation follows a definite set of quite different rules. Cloud charts are therefore more of a technique than a different brand of charts.
We think of Japanese charting as being ancient and only recently recognized in the Western world. Cloud charts, however, are a relatively recent method developed by a team of seven people in the 1930’s and not made completely public until 1968 when the team leader Goichi Hosada (1898-1982) published them in a seven volume series called “Ichimoku Kinko Hyo,” literally translated as “At a glance, balance, bar chart” (Linton, 2010). Later, a more easily read Japanese book, Table of Equilibrium at a Glance, was written and published in 1996 by Hidenobu Sasaki (in Japanese). Finally, and the source for this book, David Linton, Senior Partner of Updata plc (www.updata.co.uk) authored the best book on cloud charts in English: Cloud Charts: Trading Success with the Ichimoku Technique (2010).
The cloud chart includes five lines in different configurations (see Figure 11.16). The periods for lines are based on 9, 26, and 52 bars. Originally the chart was daily, and the periods reflected the six days in a Japanese trading week: 9 for the days in one and one half trading weeks, 26 for days in a trading month, and 52 for two months. A question arises as to whether the periods should be adjusted in the U.S. markets for five trading days per week. Other periods have been used as well for the calculations, but most available charts and software use the standard Japanese periods.
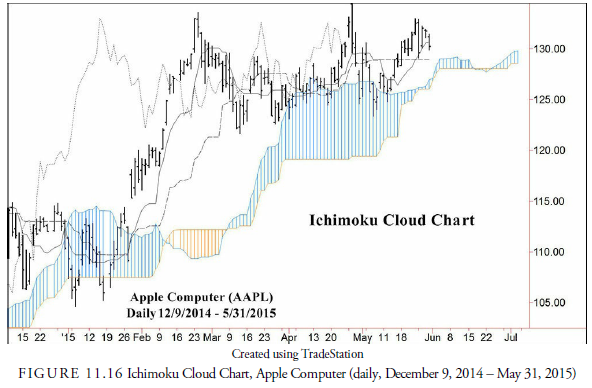
The shortest period line (Tenkan Sen) is the average of the highest high and lowest low over the past 9 bars and is plotted without a time adjustment. The second longest period line (Kijun Sen) is the average of the highest high and lowest low over the past 26 bars and is also plotted without a time adjustment. This line is often used as an indication of support and resistance and as a stop order price. The third longest period line (Chikou Span) is the current closing price shifted backwards 26 bars from the present. The final two lines enclose the “cloud.” They are the A (Senkou Span A) and B (Senkou B) lines. The A line is calculated as the average of the Tenkan Sen and Kijen Sen plotted forward 26 bars, and the B line is calculated as the average of the highest high and lowest low over the past 52 bars plotted 26 bars forward. The space that exists between these two lines on a chart constitute the “cloud,” an area where no trades should be initiated because it represents a time of equilibrium rather than trend.
From various crossings of these lines trading signals are generated. The signals are based on an assessment of the entire cloud picture and are never used solely by themselves. To become familiar with the meaning and importance of the various crossings and their implications takes study but is likely worthwhile. The technique is similar to a moving average crossover system with additional constraints.
Source: Kirkpatrick II Charles D., Dahlquist Julie R. (2015), Technical Analysis: The Complete Resource for Financial Market Technicians, FT Press; 3rd edition.
thanks ad phantran.net nhé