Devised by Ralph Nelson Elliott, the Elliott Wave Theory (EWT) is an attempt to define a structure to the stock market, and, by implication, other trading markets. EWT is based on the notion that the market behaves in an irregular cyclic manner. Proponents of EWT believe that this cyclic structure is classifiable and predictable. Defining the market structure allows the analyst to recognize where the market is within the structure and, from that, where it is proceeding next.
Because Elliott’s theory defies any strict, mathematical description, except through anecdotal evidence, its existence is difficult to prove conclusively. Thus, even among practitioners of the Elliott Wave Theory, there is much disagreement about the “where are we” aspect of the theory. The basic rules are generally agreed upon, but because of the vagaries of interpretation, no agreement or consensus seems to arise as to present conditions.
In this chapter, we outline the basics of the theory, as espoused by Robert Prechter (1990), the principal proponent of the EWT. We also provide some alternate rules, when known, from some of the other leaders in the field and include some results from computer screening. However, we leave the interpretation and much detail to further study by the student. EWT is a complex subject and deserves some thought, even if a practical application can be elusive.
1. Ralph Nelson Elliott
Born in 1871, Ralph Nelson Elliott spent most of his business career as a railroad accountant and reorganizer in Central America. After 25 years in the railroad business, he contracted a severe illness and was forced into retirement to recover. During his recovery, Elliott decided to study the stock market, having earlier subscribed to several market letters—one by Charles Collins and the other by Robert Rhea of Dow Theory fame. At the age of 63, he began his career as a stock market technical analyst, studying the Dow Jones Averages over periods from half-hours to months.
His initial discovery of the wave principle took place in early 1934. Becoming destitute, Elliott wrote to Collins asking for an arrangement by which he could be paid for market forecasts. Collins allowed him to write to him of his opinions on the market at that time, and Elliott was amazingly correct, calling several major market turns within the hour. In 1938, Collins published the first book on the Elliott wave called The Wave Principle.
In the late 1930s, Elliott moved to New York and with Collins’ financial assistance and investor referrals, began his business of newsletters, consulting, and money management. By now, Elliott was familiar with the Fibonacci sequence and had integrated it into his wave theory. Later in life, he wrote about all his discoveries in Nature’s Law—The Secret of the Universe, but his advancing age affected his writing, and the book became disjointed and rambling. Elliott died in New York in 1948. Richard Martin, a former student of Collins, Hamilton Bolton, the publisher of the Bank Credit Analyst, and Bolton’s business associate A. J. Frost were well known for applying Elliott’s theory after his death. Robert Prechter, a notable scholar of Elliott’s theory, has published all his works, including magazine articles, in The Major Works of R. N. Elliott (1980).
2. Basic Elliott Wave Theory
Elliott’s theory describes the market structure as a nested series of waves of various length and size. A wave is a sustained price move in one direction as determined by the reversal points that initiated and terminated the move. A wave cycle is composed of two waves: an impulse wave and a corrective wave. The impulse wave is in the direction of the current trend; the corrective wave moves against the trend’s direction. During a bull market, the overall trend is called a motive impulse wave (upward price movement) and ends when a downtrend begins, signaling a major change in market direction.
The wave concept that a market has positive price movement followed by a correction is simple. The benefit of EWT is that it provides the analyst with more detail about these waves. Both the impulse wave and corrective waves include special subwaves. The impulse wave is always made up of five subwaves and determines the strength and trend of the wave cycle. Analysts traditionally label these waves with numbers (1, 2, 3, or I, II, III, or i, ii, iii, and so on) based on their degree relative to longer and shorter wave cycles. See waves 1 through 5, for example, in Figure 20.1. Waves 1, 3, and 5 are smaller waves that contribute to the larger wave’s upward trend. Waves 2 and 4 are corrective subwaves; these corrective waves break the sustained upward movement.

The corrective wave is broken into three subwaves rather than five. These subwaves are labeled with letters, such as A, B, and C, as shown in Figure 20.1. Waves A and C are associated with downward price movement. Wave B breaks this downward movement with an uptrend.
In describing the specific subwaves, analysts assume an upward underlying trend at the next higher degree and, thus, a rising five-wave impulse wave and a declining three-wave corrective wave. We use the same convention, but the student must be aware that in an underlying downward trend, the same relationship between impulse wave and corrective wave holds, just in the opposite direction. In other words, the downward impulse wave would include five subwaves and three subwaves in its corrective wave upward.
Look at Figure 20.1. See how the upward motive impulse wave consists of three rising impulse subwaves, coinciding with the primary trend, and the corrective wave consists of two corrective subwaves, contrary to the primary trend. This pattern can be thought of as three steps forward and two steps backward, with each step followed by a small correction.
Figure 20.1 demonstrates how the two principal waves of the cycle, the impulse and corrective waves, can be broken down into smaller subwaves. Each of these subwaves can be broken into separate patterns. Interestingly, the patterns of each subwave will form the same general impulse and corrective Elliott pattern with and against their trend. In other words, the patterns generated from the waves are fractal—a term we used earlier in describing how chart patterns of a specific type can exist in identical shapes in short- as well as longterm charts. The patterns remain the same regardless of time or scale. Each series of waves will define a pattern within a pattern both up and down the scale.
Unfortunately, the patterns do not have definitive time limits. One of the major problems of the interpretation of Elliott waves is in deciding at what degree level a particular pattern exists. Often the shape of the wave can be interpreted as being part of one degree of magnitude of waves, when it really is part of a larger or smaller degree of waves. These different interpretations might have different implied consequences, making projections even more difficult.
To establish the order of the waves being analyzed, analysts generally begin with a long-term interpretation and reduce the inspection of waves through lower and lower degrees until the trading horizon is reached. Misinterpreting any of the waves between the long-term pattern and the trading horizon pattern, of course, can alter the interpretation of future prospects.
Each of the subwaves within either the impulse or the corrective waves can have its own peculiarities and alternative patterns. First, let us look a little more closely at the characteristics of impulse waves. Then we turn our attention to corrective waves.
4. Impulse W aves
Each impulse wave is composed of five subwaves. This impulse wave defines both the trend direction and the trend strength. Let’s consider the basic, inviolate rules of these waves and some of the patterns that can develop.
4.1. Basic Rules
There are several rules regarding the characteristics of waves. These rules are inviolate. To violate a rule is to disregard the Elliott Wave Theory and, almost certainly, to arrive at an incorrect conclusion and projection. Although there are not many rules, it is important to remember that they are strict rules that cannot be violated.
The six rules for impulse waves are as follows:
- Impulse waves move in the same direction as the trend of the next higher degree wave.
- Impulse waves divide into five subwaves.
- Within an impulse wave, subwaves 1, 3, and 5 are themselves impulse waves of a lesser degree, and subwaves 2 and 4 are corrective waves.
- Within an impulse wave, subwave 1 and 5 might be either an impulse or a diagonal pattern.
- Within an impulse wave, subwave 3 is always an impulse pattern.
- In cash markets, within an impulse pattern, subwave 4 never overlaps a portion of subwave 1. This is not always true for futures markets.
In addition to the inviolate rules, Elliott observed other wave characteristics that routinely occurred. Elliott’s observations were made without the advantage of computer power to sift through large amounts of data, and he used only the Dow Jones Industrial Average. The observations we include in this chapter are observations from computer screens of price action in many different trading markets and over many different periods (Swannell, 2003). Most of these observations agree with Elliott’s assessments, but some differ slightly. Nevertheless, the computer screens display that his observations were mostly accurate.
4.2. Impulse
Impulse patterns define the trend direction and strength. They include five subwaves, three of which move in the direction of the trend and two of which move in the direction opposite to the trend. A rising market generally has two strong subwaves: 3 and 5. In a declining market, subwave 3 is generally the strongest, and subwaves 1 and 5 are approximately equal.
Elliott Wave Theory describes the character of each subwave in more detail. The details of these subwaves are as follows:
- Wave 1 is an impulse or a leading diagonal.
- Wave 2 can be any corrective pattern but a triangle.
- Wave 2 does not retrace more than 100% of wave 1.
- Wave 3 is always an impulse.
- Wave 3 is larger than wave 2.
- Wave 3 is never shorter than waves 1 and 5.
- Wave 4 can be any corrective pattern.
- Waves 2 and 4 do not overlap in price.
- Wave 5 is an impulse or ending diagonal.
- Wave 5 retraces at least 70% of wave 4.
- In wave 5, a diagonal, extension, or truncation indicates that a major reversal is to occur soon. Diagonals
A diagonal (see Figure 20.2) is the same as the classic wedge pattern seen in classic technical patterns. It is simply a triangle formation with both bounds headed in the same direction but at different angles so that they will meet at some point in the future.

Diagonal patterns can appear in wave 1 or wave 5. If a diagonal appears in wave 1, it is called a leading diagonal. A diagonal appearing in wave 5 is called an ending diagonal. A diagonal never occurs in wave 3. The direction of the diagonal bounds is the same direction as the trend of the higher-degree impulse wave.
A leading diagonal usually consists of five subwaves of three wavelets, each a 3-3-3-3-3 configuration converging toward an apex. Occasionally, however, the configuration is 5-3-5-3-5, just as in an impulse but with the overlapping of waves 2 and 4 (Frost and Prechter, 2000).
An ending diagonal also includes five subwaves, each of which is in turn subdivided into three smaller waves. Often, the fifth subwave will break out of the diagonal’s bounds for a short period before reversing. This is called a throw-over (Frost and Prechter, 2000).
A throw-over is an “elongated impulse with exaggerated subdivisions” (Frost and Prechter, 2000, p. 31). Usually an extension will occur in only one of the subwaves in an impulse pattern. Thus, if waves 1 and 5 are approximately the same length, wave 3 likely will be extended. In fact, the third wave extension is the most common extended wave pattern in the stock market. In commodities, however, the extended wave is usually the fifth wave. When extended, a wave often appears to have nine subwaves rather than the usual five. This is because the extended wavelets are large enough to appear the same size as the subwaves themselves.
5. T runcation
Occasionally, the fifth wave fails to exceed the end of the third wave. This phenomenon is shown in Figure 20.3. Elliott referred to this as a “failure.” Nevertheless, a truncated fifth wave will still have five subwaves.

5.1. Corrective Waves
Corrective waves are unquestionably the most difficult to interpret. They can appear in many different configurations and pattern combinations. Both Richard Swannell and Robert Prechter have contributed to our current understanding of corrective waves. Swannell has tested price data, searching for waves, and Prechter has interpreted Elliott’s original work with some modifications. The following information about corrective waves comes from the work of these two analysts.
Corrective waves commonly occur in three subwaves (A-B-C). The direction of corrective waves is either sideways, as in a trading range, or sharply opposite to the prevailing trend of the impulse wave. Corrective waves are generalized into three categories for descriptive purposes: zigzags, flats, and triangles.
5.2. Zigzags
The single A-B-C correction in Figure 20.4 is an example of a zigzag correction. Generally, in a simple zigzag, wave A is an impulse, leading diagonal, or zigzag; wave B is any corrective pattern; and wave C is an impulse, ending diagonal, or zigzag. If wave A is a diagonal, wave C is not an ending diagonal.

In addition to this simple, single A-B-C correction, a zigzag correction can occur as a more complex double or triple zigzag pattern. The second correction pictured in Figure 20.4 shows the more complex double zigzag. Double and triple zigzags use different nomenclature for their descriptions. The double zigzag, for example, is two simple zigzags joined by a wave X. As shown in Figure 20.4, W and Y are often used to designate each simple zigzag wave within the double zigzag. When another simple zigzag is added to a double zigzag, a triple zigzag forms. The added simple zigzag is referred to as wave Z; the intervening wave is labeled XX. Fortunately, for interpretive purposes, triple zigzags are rare.
Swannell (2003) provides the following characteristics for actual double zigzags:
- Wave W is a zigzag.
- Wave X is any corrective pattern other than an expanding triangle.
- Wave X is smaller than wave W.
- Wave Y is a zigzag.
- Wave Y is equal to or larger than wave X.
Triple zigzags continue with the same pattern as double zigzags; thus, wave XX is smaller than both wave Y and Z. Prechter points out that zigzags characteristically have a 5-3-5 combination of subwaves.
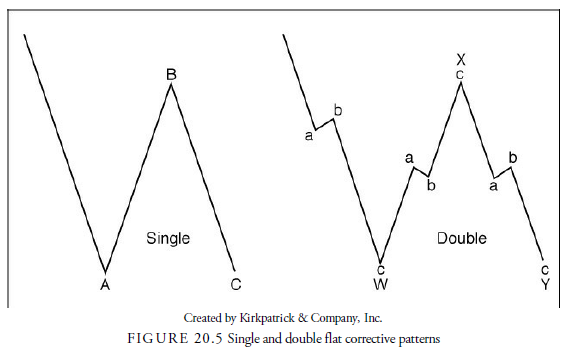
5.3. Flats
Sideways patterns are called flats. Flats behave very similarly to zigzags except that rather than sharp upward or downward corrections to the prevailing trend, they move sideways, and their subwaves generally overlap. The characteristics for flats are the same as for zigzags except that
- Wave B is not a triangle, retraces wave A by at least 50%, and is less than twice the length of wave A.
- Wave C overlaps wave A at some point.
The A-B-C pattern in Figure 20.5 shows a simple flat pattern. In addition to this single A-B-C pattern, flats can occur as a double or a triple. Double and triple flats have the same nomenclature as double and triple zigzags. Just like triple zigzags, triple flats are rare. The characteristics of the double and triple flats are similar to their zigzag counterparts except for the necessary adjustments needed to produce a sideways pattern. Thus, common characteristics of these multiple flat patterns are as follows:
- Waves W, X, and XX can be any corrective pattern except a triangle, a double, or a triple.
- Waves Y and Z can be any corrective pattern except a double or triple.
- Wave X retraces at least 50% of wave W.
- Wave Y is greater than wave X unless it is a triangle.
- Wave XX retraces at least 50% of wave Y.
- Wave Z is not a zigzag if wave Y is a zigzag.
- Wave Z is greater than wave XX.
Prechter points out that flats characteristically have a 3-3-5 combination of subwaves. Elliott, he argues, considered the sideways patterns as possibly including a combination of zigzag and flat, one followed by the other in a complex corrective wave. These were called doubles and triple threes. The method of designating each pattern is the same as the method used previously for double and triple sideways patterns.
6. T riangles
The Elliott wave triangle is identical to the standard triangle pattern we discussed in Chapter 15, “Bar Chart Patterns,” with the exception that it is limited to five waves (A-B-C-D-E). Prechter points out that triangles have a 3-3-3-3-3 combination of minor waves. The Elliott wave triangle can be either a converging or a diverging triangle.
The rules for a converging triangle are as follows:
- Wave A is a zigzag or a flat.
- Wave B is only a zigzag.
- Waves C and D can be any corrective pattern except a triangle.
- Waves A, B, C, and D move within the bounds of the channel lines between A to C and B to D.
- Bounds converge (one might be horizontal), and the intersection of the bounds occurs beyond the end of wave E.
- Wave E can be a zigzag or a converging triangle.
- Either wave A or wave B is the longest wave.
- Wave E ends in the range of wave A.
- Wave E moves within or closes within the bounds.
Expanding triangles, although relatively rare, have generally the same rules. The exceptions are that for the expanding triangle
- Wave B is smaller than wave C but more than 40% of wave C.
- Wave C is smaller than wave D but more than 40% of wave D.
- The intersection of the bounds occurs before the formation of the triangle.
- Wave E is longer than wave D.
- Wave E ends outside the territory of wave A.
- Either wave A or wave B is the shortest wave.
7. Guidelines and General Characteristics in EWT
In addition to rules, guidelines exist within EWT. Although the rules are inviolate, EWT guidelines are less definite and will not occur at all times.
7.1. Alternation
Alternation is an EWT guideline. Alternation refers to the common occurrence of one type of corrective wave occurring in wave 2 and a different type of correction occurring in wave 4. In other words, the types of corrective waves tend to alternate. If wave 2 is a flat, for example, wave 4 will likely be some other type of corrective wave, such as a zigzag or a triangle. The guideline of alternation can also occur in a corrective wave when, for example, the first part of a double is a zigzag and the second part is a flat, as shown in Figure 20.6.

7.2. Equality
At least two of the three impulse subwaves in a five-wave sequence are often equal in length. Usually equality exists between wave 1 and wave 5, especially when wave 3 is extended. However, if wave 1 or wave 5 is extended, the remaining two will tend toward equality.
7.3. Channeling
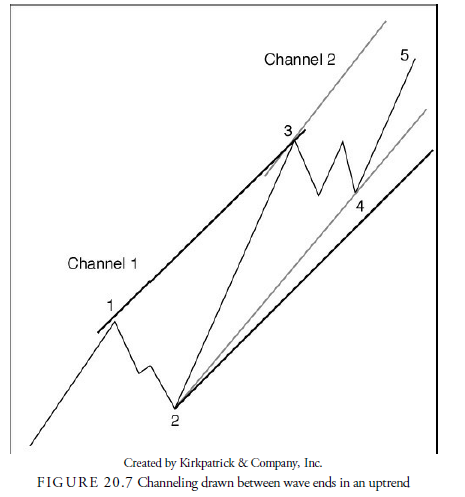
Channels, similar to those we discussed in Chapter 14, “Moving Averages,” are used in conjunction with EWT. To construct a channel for a five-wave impulse, draw a line between the end of wave 1 and wave 3; then draw a parallel line through the end of wave 2. Price will tend to oscillate within this channel.
Sometimes wave 4 falls short of the lower channel line, as shown in Figure 20.7. When this occurs, draw a new line from the end of wave 2 to the end of wave 4. This line will be steeper than the original lower channel line. Then draw another parallel line running through the end of wave 3. This will give a rough approximation of where wave 5 should end. A throw-over occurs when wave 5 exceeds this second channel line and usually denotes excessive emotion in the market and possibly an extended fifth wave.
Some analysts use the channeling method for projections. These channels are useful because all price movement should lie within the channel. Prechter, however, mentions that two guidelines for target projections are available in addition to the channeling method. The first occurs in wave 4. The extent of the larger wave 4 correction should be no further than the end of wave 4 of lesser degree. In other words, the larger wave 4 should not break through the end of the minor wave 4 in the larger wave 3 preceding the larger wave 4. The fourth wave target is shown in Figure 20.8.

Figure 20.9 illustrates a projection that occurs at the end of wave 5 extensions. When wave 5 extends, the corrective wave that follows is steep and often ends either at the minor wave 2 of the extended wave 5 or at the end of wave 4. In other words, the corrective wave following an extended wave 5 often corrects all or most of the extended wave 5 move.

From his screening of actual patterns, Swannell (2003) reports that the most accurate patterns for predicted results are the triangle and ending diagonal. Their consistent behavior after their completion gives results accurate enough to be almost 90% dependable.
Other means of estimating target prices have been proposed. Hill, Pruitt, and Hill (2000), for example, estimate that in impulses, the target for wave 3 is 50% of wave 1 added to wave 1, and the target for wave 5 is 100% of wave 1 added to wave 1. Their estimates of retracements are based on the length of wave A, the first correction wave. If wave A corrects 25% to 35% of the prior impulse wave, it will likely be only a single wave correction. If wave A corrects 35% to 50%, the correction will likely be a three-wave correction, and if wave A corrects 50% to 75%, it will likely be a five-wave correction. Any reaction more than 75% suggests a possible trend change.
The most common methods of determining targets and replacements use multiples of the Fibonacci ratios. We now turn our attention to the derivation of these numbers.
8. Alternatives to EWT
As would be expected with a theory that is so difficult to apply, many analysts have differing opinions about Elliott rules and guidelines. Most of these analysts stick with the general principles of impulse waves and corrective waves and their five-wave and three-wave subdivisions, but the application of other observations in the specific waves and interpretations of Elliott can sometimes cause quite differing results.
In his book Mastering Elliott Wave, Glenn Neely (1990) takes the reader from the most simple wave construction through an extremely lengthy set of rules that encompass his theory of how waves unfold. In doing so, the reader learns by practice how to set up an Elliott wave chart using the Neely method of dots rather than bar charts, how to determine monowaves and their larger patterns, and other nomenclature and idiosyncrasies of Elliott analysis.
The late Zoran Gayer, a student of the Neely school of Elliott analysis, developed a sophisticated approach called bifurcation. This method is an offshoot of chaos theory, where motion goes from erratic to organized, just as prices go from consolidation to trending. In Elliott terms, this would equate to going from corrective waves to impulse waves. Zoran, as he was known, called them directional and nondirectional moves. Directional moves are those that do not correct more than 61.8%. The bifurcation points are not necessarily the extreme high or low of a wave but can occur when the price action changes tone and direction, such as at the end of wave 3 in conventional Elliott labeling. The method becomes complicated and requires close study. Past Zoran commentaries can be seen at http://www.safehaven.com/author/11/zoran-gayer.
As with all the preceding methods, the assumptions underlying the market structure are that prices are determined by patterns of human nature and sentiment. Elliott believed that sentiment rose and fell in fits and starts that could be identified and labeled with his wave structure. That these fits and starts followed a mathematical sequence such as the Fibonacci sequence came as no surprise to Elliott.
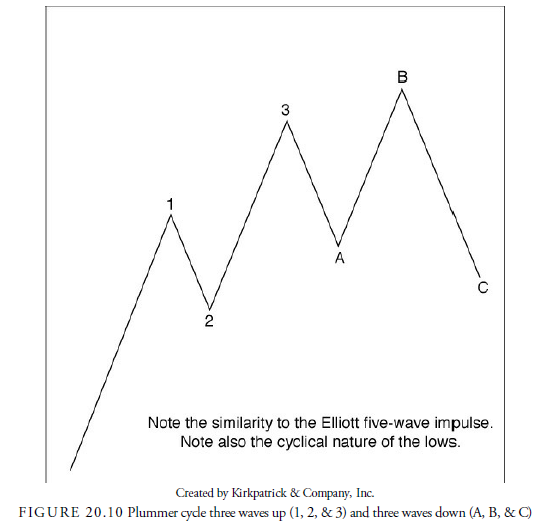
However, Elliott’s hypothetical structure has been analyzed by others who have used different growth structure models, even assuming that the controlling mathematics are still the Fibonacci ratios. Tony Plummer (2003), for example, hypothesizes that the growth curve of nature as well as sentiment in markets is a three- wave process influenced by shock. Shock need not be exogenous. It can be just the sudden realization that the markets have changed direction. Thus, the three-wave sequence consists of the first wave changed by natural causes and its natural completion in a normal growth curve, then a flat period as the new circumstances are evaluated, and finally the realization that the trend has changed and a second directional move. The entire cycle is composed of a zigzag up of three legs and a zigzag down, three separate cycles within the longer cycle, as illustrated in Figure 20.10. Using this method, Plummer maintains that he has been able to integrate Fibonacci, cycle analysis, and EWT into a simpler and more easily understood method of recognizing structure in the markets.
9. Using EWT
Although the theory of market structure is interesting, the point in technical analysis is to use these theories to make profits. With Elliott analysis, this is difficult. The application of the rules always seems to have exceptions, the description of waves often can only be determined after the fact, and the means of projecting into the future are suspect. This is not to say that the theories do not have value. They do, and at certain instances they can be profitably utilized. To do this, the analyst must be fully trained in Elliott analysis and be patient enough to wait for an opportunity that is clearly within the realm of the implied Elliott structure. Because Elliott analysis is not easily computerized, its practical interpretation needs other technical tools before any profitable signals can be derived.
Steven Poser (2003) is correct in stating that too many Elliott analysts attempt to pick the top and bottom of moves rather than take a piece out of the middle. They overanalyze the waves and generally become overwhelmed by minutia. He suggests that at least two other technical methods must confirm any Elliott wave expectation. Other suggestions are to determine the period in which the analyst is most interested and analyze the next higher and lower degree waves to establish the context within which trading or investing will occur. Establish key price levels, he says, such as targets, retracement levels, and important reversal points based on the Elliott analysis, and use other indicators such as moving averages and oscillators to confirm action signals. For example, he looks for momentum confirmation in wave 3 and divergences in wave 5. More important, he argues, the analyst must be aware of the behavior of the market especially at certain juncture points. The Elliott Wave Theory is a model of behavior—a useful means of understanding the position of the market within itself, not a mechanical system of forecasting.
Connie Brown (1994, 1999), who worked for Prechter for a few years and is now a professional trader and adviser, has devised oscillators to confirm waves within an Elliott context. She simplifies Elliott’s basic rules into a five-wave pattern, where waves 1, 3, and 5 are impulses:
- Wave 2 might not break below the origin of wave 1.
- Wave 3 cannot be the shortest wave, but it does not necessarily have to be the longest.
- Wave 4 cannot overlap the termination of wave 1.
Rather than becoming obsessed with the smaller threes and fives and other patterns, Brown claims that getting a feel for the rhythm in the market is more important. By compressing the scale in a chart, the smaller, less important details become obscure, and attention then focuses on the market rhythm. Professional expertise is not needed to make money from this pattern. To determine the Elliott five-wave pattern, Brown begins at the middle of a pattern where the largest price move occurred and looks forward and backward (uncovering price action by widening the distance between her thumbnails that are covering price action before and after the large price move). She then uses Fibonacci ratios, Gann time, and price projections combined with oscillators based on the RSI and her composite index to estimate price projections and give action signals.
Source: Kirkpatrick II Charles D., Dahlquist Julie R. (2015), Technical Analysis: The Complete Resource for Financial Market Technicians, FT Press; 3rd edition.
very appropriate article