Sometimes you want to compare the mean of a sample with a hypothesized population mean to see if your sample is significantly different. For example, the scholastic aptitude test was originally standardized so that the mean was 500 and the standard deviation was 100. In our modified HSB data set, we made up mock scholastic aptitude test – math (SAT Math) scores for each student. You may remember from Chapter 3 that the mean SAT Math score for our sample was 490.53. Is this significantly different from 500?
- Is the mean SAT Math score in the modified HSB data set significantly different from the presumed population mean of 500?
Assumptions of the One-Sample t Test:
- The dependent variable is normally distributed within the population.
- The data are independent (scores of one participant are not dependent on scores of the others; participants are independent of one another).
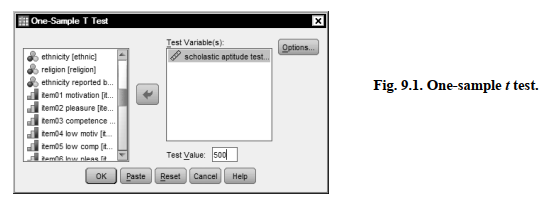
To compute the one-sample t test, use the following commands:
- Analyze → Compare Means → One-Sample T Test…
- Move scholastic aptitude test – math to the Test Variable(s)
- Type 500 in the Test Value box (the test value is the score that you want to compare to your sample mean).
- Your window should look like Fig. 9.1
- Click OK.
Source: Morgan George A, Leech Nancy L., Gloeckner Gene W., Barrett Karen C.
(2012), IBM SPSS for Introductory Statistics: Use and Interpretation, Routledge; 5th edition; download Datasets and Materials.
27 Mar 2023
16 Sep 2022
15 Sep 2022
17 Sep 2022
27 Mar 2023
20 Sep 2022