Again, is it reasonable to add the scores for these items together to form summated measures of the concepts of competence and pleasure?
- What is the internal consistency reliability of the competence scale?
- What is the internal consistency reliability of the pleasure scale?
Let’s repeat the same steps as before to check the reliability of the following scales and then compare your output to 3.2 and 3.3.
- For the competence scale, use item03, item05 reversed, item09, and itemll reversed.
r Remember to change the Scale Label to “Alpha for Competence Scale.”
- For the pleasure scale, use item02, item06 reversed, item10 reversed, and item14.
- Change the Scale Label to “Alpha for Pleasure Scale.”
- This time unclick the checks for Scale and for Correlations under InterItem to make the output shorter.
- Click OK.
Output 3.2: Cronbach’s Alpha for the Math Attitude Competence Scale
RELIABILITY
/VARIABLES=item03 item05r item09 item11r
/SCALE(‘Alpha for Competence Scale’) ALL
/MODEL=ALPHA
/STATISTICS=DESCRIPTIVE SCALE CORR /SUMMARY=TOTAL MEANS CORR.
Reliability
Scale: Alpha for Competence Scale
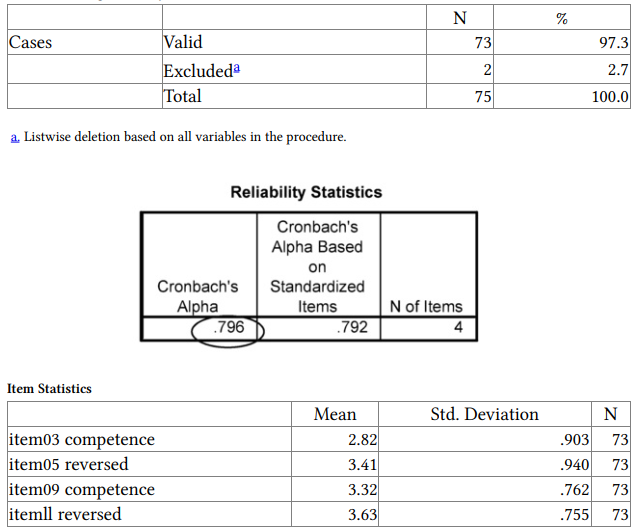

Interpretation of Output 3.2
Note that the Alpha is .80, an acceptable internal consistency reliability. The Item Statistics table shows that you have 73 students with data on all four items as well as reasonable means and SDs. The Summary Item Statistic table shows that the mean of the four items is 3.30; the mean correlation among the items is .49 and varies from a low of .33 to a high of .74. All the Corrected Item-Total Correlations are above .40, which is good.
Output 3.3: Cronbach’s Alpha for the Math Attitude Pleasure Scale
RELIABILITY
/VARIABLES=item02 item06r item10r item14
/SCALE(‘Alpha for Pleasure Scale’) ALL
/MODEL=ALPHA
/STATISTICS=DESCRIPTIVE SCALE CORR
/SUMMARY=TOTAL MEANS CORR.
Reliability
Scale: Alpha for Pleasure Scale
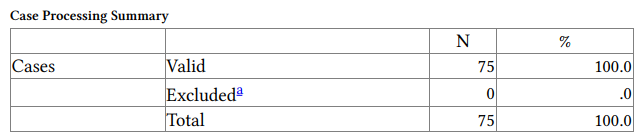
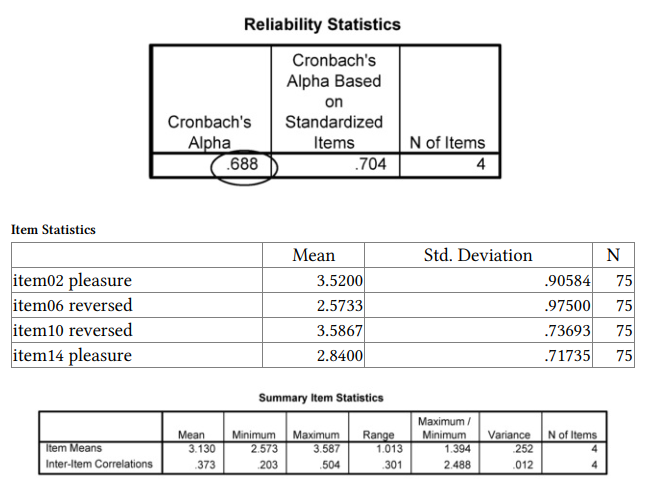
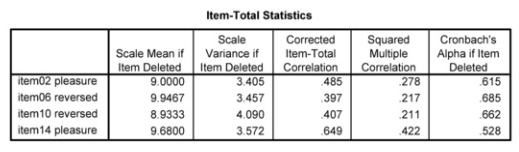
Interpretation of Output 3.3
The Alpha is .69, which is lower than desirable, partly because there are only four items in the scale. Note that the mean Inter-Item Correlation is .37 and the lowest correlation is only .20. The Corrected Item-Total Correlation for item06 is a little low at .397, but deleting it would not improve the alpha.
Source: Leech Nancy L. (2014), IBM SPSS for Intermediate Statistics, Routledge; 5th edition;
download Datasets and Materials.
27 Mar 2023
14 Sep 2022
31 Mar 2023
19 Sep 2022
19 Sep 2022
15 Sep 2022