In order to get a better “feel” for the data and to check for other types of errors or problems on the questionnaires, we recommend that you run the statistics program called Descriptives. To compute basic descriptive statistics for all your subjects, you will need to do these steps:
- Select Analyze → Descriptive Statistics → .. (see Fig. 2.14).[I]

Fig. 2.14 Analyze menu.
After selecting Descriptives, you will be ready to compute the mean, minimum, and maximum values for all participants or cases on all variables in order to examine the data.
- Now highlight all of the variables. To highlight, click on the first variable, then hold down the “shift” key and click on the last variable so that all of the variables listed are highlighted (see Fig. 2.15a). Note that in SPSS 14 and later versions, there is a symbol to the left of each variable name; it indicates whether you have labeled the measurement level as nominal , ordinal J, or scale . Measurement levels are discussed in detail in Chapter 3 of this book.
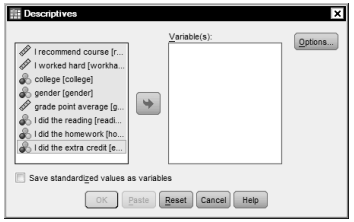
Fig. 2.15a. Descriptives—before moving variables.
Click on the arrow button pointing right. The Descriptives dialog box should now look like Fig. 2.15b.
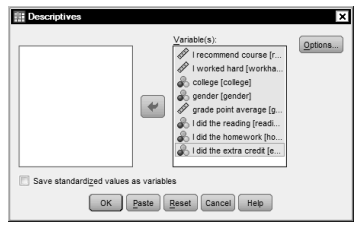
Fig. 2.15b. Descriptives—after moving variables.
- Be sure that all of the variables have moved out of the left window. If your screen looks like Fig. 2.15b, then click on Options. You will get Fig. 2.16.
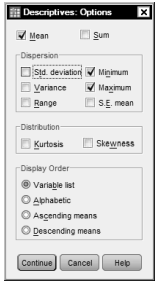
Fig. 2.16. Descriptives: Options.
Follow these steps:
- Notice that the Mean, Std. deviation, Minimum, and Maximum were already checked. Click off deviation. At this time, we will not request more descriptive statistics. We will do them in Chapter 4.
- Ensure that the Variable list bubble is checked in the Display Order Note: You can also click on Ascending or Descending means if you want your variables listed in order of the means. If you wanted the variables listed alphabetically, you would check Alphabetic.
- Click on Continue, which will bring you back to the main Descriptives dialog box (Fig. 2.15b).
- Then click on OK to run the program.
You should get an output like Fig. 2.17. If it looks similar, you have done the steps correctly.

Fig. 2.17. Output viewer for Descriptives.
The left side of Fig. 2.17 lists the various parts of your output. You can click on any item on the left (e.g., Title, Notes, or Descriptive Statistics) to activate the output for that item, and then you can edit it. For example, you can click on Title and then expand the title or add information such as your name and the date. (See Appendix A for more on editing outputs.)
- Double click on the large, bold word Descriptives in Fig. 2.17. Type your name in the box that appears so it will appear on your output when you print it later. Also type “Output 2.2” at the top so you and/or your instructor will know what it is later.
For each variable, compare the minimum and maximum scores in Fig. 2.17 with the highest and lowest appropriate values in the codebook (Output 2.1). This checking of data before doing any more statistics is important to further ensure that data entry errors have not been made and that the missing data codes are being used properly.
Note that after each output we have provided a brief interpretation in a box. On the output itself, we have pointed out some of the key things by circling them and making some comments in boxes, which are known as callout boxes. Of course, these circles and information boxes will not show up on your printout.
Output 2.2: Descriptives
DESCRIPTIVES VARIABLES=recommend workhard college gender gpa reading homework extracrd /STATISTICS=MEAN STDDEV MIN MAX .
Descriptives

[I] This is how we indicate, in this and the following chapters, that you first pull down the Analyze menu, then select Descriptive Statistics from the first flyout menu, and finally select Descriptives from the last flyout menu.
Source: Morgan George A, Leech Nancy L., Gloeckner Gene W., Barrett Karen C.
(2012), IBM SPSS for Introductory Statistics: Use and Interpretation, Routledge; 5th edition; download Datasets and Materials.
31 Mar 2023
14 Sep 2022
21 Sep 2022
20 Sep 2022
20 Sep 2022
31 Mar 2023