Many business and economic series reported over time, such as company sales, industry sales, and inventories, are measured in dollar amounts. These time series often show an increasing growth pattern over time, which is generally interpreted as indicating an increase in the physical volume associated with the activities. For example, a total dollar amount of inventory up by 10% might be interpreted to mean that the physical inventory is 10% larger. Such interpretations can be misleading if a time series is measured in terms of dollars, and the total dollar amount is a combination of both price and quantity changes. Hence, in periods when price changes are significant, the changes in the dollar amounts may not be indicative of quantity changes unless we are able to adjust the time series to eliminate the price change effect.
For example, from 1976 to 1980, the total amount of spending in the construction industry increased approximately 75%. That figure suggests excellent growth in construction activity. However, construction prices were increasing just as fast as—or sometimes even faster than—the 75% rate. In fact, while total construction spending was increasing, construction activity was staying relatively constant or, as in the case of new housing starts, decreasing. To interpret construction activity correctly for the 1976-1980 period, we must adjust the total spending series by a price index to remove the price increase effect. Whenever we remove the price increase effect from a time series, we say we are deflating the series.
In relation to personal income and wages, we often hear discussions about issues such as “real wages” or the “purchasing power” of wages. These concepts are based on the notion of deflating a nominal hourly wage. For example, Figure 20.2 shows the pattern of hourly wages of electricians for the period 2010-2014. We see a trend of wage increases from $24.91 per hour to $26.21 per hour. Should electricians be pleased with this growth in hourly wages? The answer depends on what happened to the purchasing power of their wages. If we can compare the purchasing power of the $24.91 hourly wage in 2010 with the purchasing power of the $26.21 hourly wage in 2014, we will be better able to judge the relative improvement in wages.
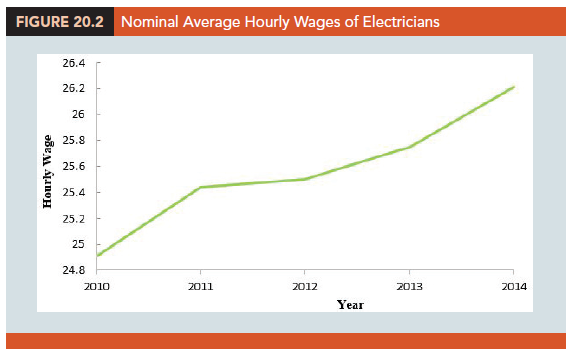
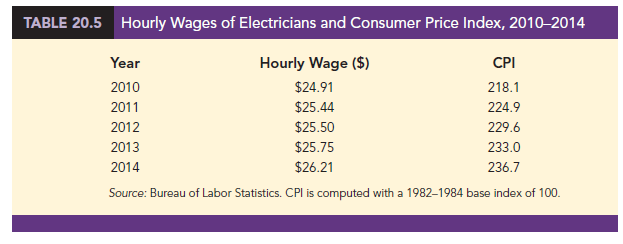
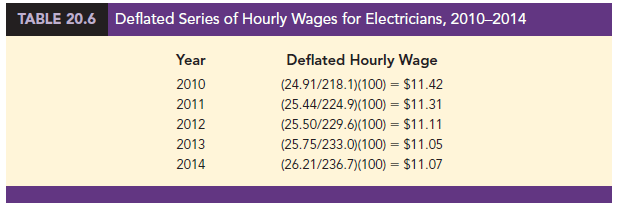
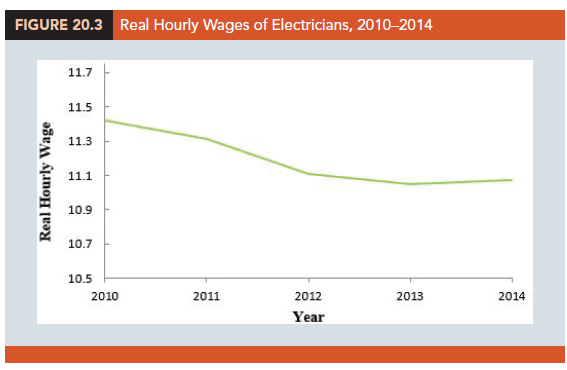
Table 20.5 reports both the hourly wage rate and the CPI (computed with a 1982-1984 base index of 100) for the period 2010-2014. With these data, we will show how the CPI can be used to deflate the index of hourly wages. The deflated series is found by dividing the hourly wage rate in each year by the corresponding value of the CPI and multiplying by 100. The deflated hourly wage index for electricians is given in Table 20.6; Figure 20.3 is a graph showing the deflated, or real, wages.
What does the deflated series of wages tell us about the real wages or purchasing power of electricians during the 2010-2014 period? In terms of base period dollars (1982-1984 = 100), the hourly wage rate has decreased over the period. After removing the inflationary effect we see that the purchasing power of the workers actually decreased by $.35 over the four-year period. This effect is seen in Figure 20.3. Thus, the advantage of using price indexes to deflate a series is that they give us a clearer picture of the real dollar changes that are occurring.
This process of deflating a series measured over time has an important application in the computation of the gross domestic product (GDP). The GDP is the total value of all goods and services produced in a given country. Obviously, over time the GDP will show gains that are in part due to price increases if the GDP is not deflated by a price index. Therefore, to adjust the total value of goods and services to reflect actual changes in the volume of goods and services produced and sold, the GDP must be computed with a price index deflator. The process is similar to that discussed in the real wages computation.
Source: Anderson David R., Sweeney Dennis J., Williams Thomas A. (2019), Statistics for Business & Economics, Cengage Learning; 14th edition.
28 Aug 2021
31 Aug 2021
30 Aug 2021
31 Aug 2021
31 Aug 2021
28 Aug 2021