Data can be obtained from existing sources, by conducting an observational study, or by conducting an experiment.
1. Existing Sources
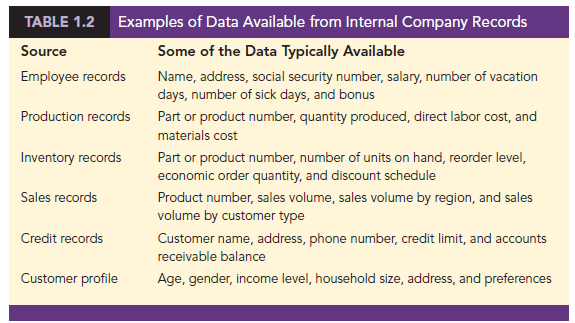
In some cases, data needed for a particular application already exist. Companies maintain a variety of databases about their employees, customers, and business operations. Data on employee salaries, ages, and years of experience can usually be obtained from internal personnel records. Other internal records contain data on sales, advertising expenditures, distribution costs, inventory levels, and production quantities. Most companies also maintain detailed data about their customers. Table 1.2 shows some of the data commonly available from internal company records.
Organizations that specialize in collecting and maintaining data make available substantial amounts of business and economic data. Companies access these external data sources through leasing arrangements or by purchase. Dun & Bradstreet, Bloomberg, and Dow Jones & Company are three firms that provide extensive business database services to clients. The Nielsen Company and IRI built successful businesses collecting and processing data that they sell to advertisers and product manufacturers.
Data are also available from a variety of industry associations and special interest organizations. The U.S. Travel Association maintains travel-related information such as the number of tourists and travel expenditures by states. Such data would be of interest to firms and individuals in the travel industry. The Graduate Management Admission Council maintains data on test scores, student characteristics, and graduate management education programs. Most of the data from these types of sources are available to qualified users at a modest cost.
The Internet is an important source of data and statistical information. Almost all companies maintain websites that provide general information about the company as well as data on sales, number of employees, number of products, product prices, and product specifications. In addition, a number of companies, including Google, Yahoo, and others, now specialize in making information available over the Internet. As a result, one can obtain access to stock quotes, meal prices at restaurants, salary data, and an almost infinite variety of information. Some social media companies such as Twitter provide application programming interfaces (APIs) that allow developers to access large amounts of data generated by users. These data can be extremely valuable to companies who want to know more about how existing and potential customers feel about their products.
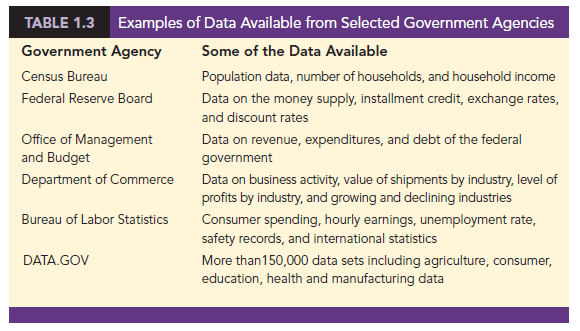
Government agencies are another important source of existing data. For instance, the website DATA.GOV was launched by the U.S. government in 2009 to make it easier for the public to access data collected by the U.S. federal government. The DATA.GOV website includes more than 150,000 data sets from a variety of U.S. federal departments and agencies, but there are many other federal agencies who maintain their own websites and data repositories. Table 1.3 lists selected governmental agencies and some of the data they provide. Figure 1.3 shows the home page for the DATA.GOV website. Many state and local governments are also now providing data sets online. As examples, the states of California and Texas maintain open data portals at data.ca.gov and data.texas.gov, respectively. New York City’s open data website is opendata.cityofnewyork.us, and the city of Cincinnati, Ohio, is at data.cincinnati-oh.gov.
2. Observational Study
In an observational study we simply observe what is happening in a particular situation, record data on one or more variables of interest, and conduct a statistical analysis of the resulting data. For example, researchers might observe a randomly selected group of customers that enter a Walmart supercenter to collect data on variables such as the length of time the customer spends shopping, the gender of the customer, the amount spent, and so on. Statistical analysis of the data may help management determine how factors such as the length of time shopping and the gender of the customer affect the amount spent.
As another example of an observational study, suppose that researchers were interested in investigating the relationship between the gender of the CEO for a Fortune 500 company and the performance of the company as measured by the return on equity (ROE). To obtain data, the researchers selected a sample of companies and recorded the gender of the CEO and the ROE for each company. Statistical analysis of the data can help determine the relationship between performance of the company and the gender of the CEO. This example is an observational study because the researchers had no control over the gender of the CEO or the ROE at each of the companies that were sampled.
Surveys and public opinion polls are two other examples of commonly used observational studies. The data provided by these types of studies simply enable us to observe opinions of the respondents. For example, the New York State legislature commissioned a telephone survey in which residents were asked if they would support or oppose an increase in the state gasoline tax in order to provide funding for bridge and highway repairs. Statistical analysis of the survey results will assist the state legislature in determining if it should introduce a bill to increase gasoline taxes.
3. Experiment
The key difference between an observational study and an experiment is that an experiment is conducted under controlled conditions. As a result, the data obtained from a well-designed experiment can often provide more information as compared to the data obtained from existing sources or by conducting an observational study. For example, suppose a pharmaceutical company would like to learn about how a new drug it has developed affects blood pressure. To obtain data about how the new drug affects blood pressure, researchers selected a sample of individuals. Different groups of individuals are given different dosage levels of the new drug, and before and after data on blood pressure are collected for each group. Statistical analysis of the data can help determine how the new drug affects blood pressure.
The types of experiments we deal with in statistics often begin with the identification of a particular variable of interest. Then one or more other variables are identified and controlled so that data can be obtained about how the other variables influence the primary variable of interest.
4. Time and Cost Issues
Anyone wanting to use data and statistical analysis as aids to decision making must be aware of the time and cost required to obtain the data. The use of existing data sources is desirable when data must be obtained in a relatively short period of time. If important data are not readily available from an existing source, the additional time and cost involved in obtaining the data must be taken into account. In all cases, the decision maker should consider the contribution of the statistical analysis to the decision-making process. The cost of data acquisition and the subsequent statistical analysis should not exceed the savings generated by using the information to make a better decision.
5. Data Acquisition Errors
Managers should always be aware of the possibility of data errors in statistical studies. Using erroneous data can be worse than not using any data at all. An error in data acquisition occurs whenever the data value obtained is not equal to the true or actual value that would be obtained with a correct procedure. Such errors can occur in a number of ways. For example, an interviewer might make a recording error, such as a transposition in writing the age of a 24-year-old person as 42, or the person answering an interview question might misinterpret the question and provide an incorrect response.
Experienced data analysts take great care in collecting and recording data to ensure that errors are not made. Special procedures can be used to check for internal consistency of the data. For instance, such procedures would indicate that the analyst should review the accuracy of data for a respondent shown to be 22 years of age but reporting 20 years of work experience. Data analysts also review data with unusually large and small values, called outliers, which are candidates for possible data errors. In Chapter 3 we present some of the methods statisticians use to identify outliers.
Errors often occur during data acquisition. Blindly using any data that happen to be available or using data that were acquired with little care can result in misleading information and bad decisions. Thus, taking steps to acquire accurate data can help ensure reliable and valuable decision-making information.
Source: Anderson David R., Sweeney Dennis J., Williams Thomas A. (2019), Statistics for Business & Economics, Cengage Learning; 14th edition.
31 Aug 2021
28 Aug 2021
31 Aug 2021
28 Aug 2021
31 Aug 2021
28 Aug 2021