We identified the procedures used to compute price indexes for single items or groups of items. Now let us consider some price indexes that are important measures of business and economic conditions. Specifically, we consider the Consumer Price Index, the Producer Price Index, and the Dow Jones averages.
1. Consumer Price Index
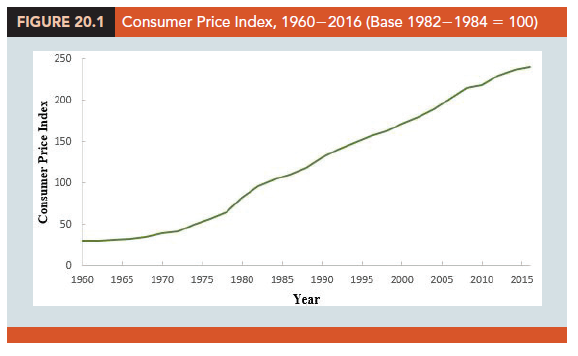
The Consumer Price Index (CPI), published monthly by the U.S. Bureau of Labor Statistics, is the primary measure of the cost of living in the United States. The group of items used to develop the index consists of a market basket of 400 items including food, housing, clothing, transportation, and medical items. The CPI is a weighted aggregate price index with fixed weights.1 The weight applied to each item in the market basket derives from a usage survey of urban families throughout the United States.
The May 2018 CPI, computed with a 1982-1984 base index of 100, was 250.5. This figure means that the cost of purchasing the market basket of goods and services increased 150.5% since the base period 1982-1984. The time series of the CPI from 1960-2016 is shown in Figure 20.1. Note how the CPI measure reflects the sharp inflationary behavior of the economy in the late 1970s and early 1980s.
2. Producer Price Index
The Producer Price Index (PPI), also published monthly by the U.S. Bureau of Labor Statistics, measures the monthly changes in prices in primary markets in the United States. The PPI is based on prices for the first transaction of each product in nonretail markets. All commodities sold in commercial transactions in these markets are represented. The survey covers raw, manufactured, and processed goods at each level of processing and includes the output of industries classified as manufacturing, agriculture, forestry, fishing, mining, gas and electricity, and public utilities. One of the common uses of this index is as a leading indicator of the future trend of consumer prices and the cost of living. An increase in the PPI reflects producer price increases that will eventually be passed on to the consumer through higher retail prices.
Weights for the various items in the PPI are based on the value of shipments. The weighted average of price relatives is calculated by the Laspeyres method. The May 2018 PPI, computed with a 1982 base index of 100, was 195.9.
3. Dow Jones Averages
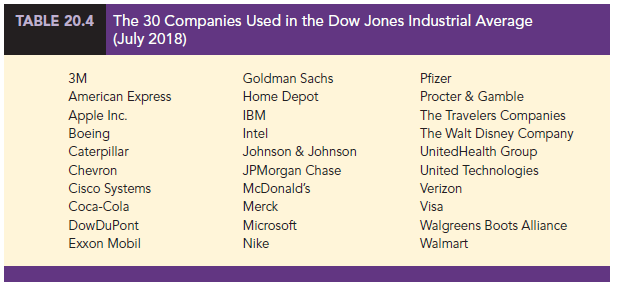
The Dow Jones averages are indexes designed to show price trends and movements associated with common stocks. The best known of the Dow Jones indexes is the Dow Jones Industrial Average (DJIA), which is based on common stock prices of 30 large companies. It is the sum of these stock prices divided by a number, which is revised from time to time to adjust for stock splits and switching of companies in the index. Unlike the other price indexes that we studied, it is not expressed as a percentage of base-year prices. The specific firms used in July 2018 to compute the DJIA are listed in Table 20.4.
Other Dow Jones averages are computed for 20 transportation stocks and for 15 utility stocks. The Dow Jones averages are computed and published daily in The Wall Street Journal and other financial publications.
Source: Anderson David R., Sweeney Dennis J., Williams Thomas A. (2019), Statistics for Business & Economics, Cengage Learning; 14th edition.
30 Aug 2021
30 Aug 2021
31 Aug 2021
30 Aug 2021
28 Aug 2021
30 Aug 2021