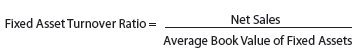
A measure of a company’s efficiency in using its fixed assets to generate revenue is the fixed asset turnover ratio. The fixed asset turnover ratio measures the number of dollars of sales earned per dollar of fixed assets. It is computed as follows:
To illustrate, the following data (in millions) were taken from recent financial statements of Starbucks Corporation.
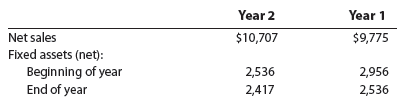
Starbucks’ fixed asset turnover ratios for Year 2 and Year 1 are computed as follows:

The higher the fixed asset turnover, the more efficiently a company is using its fixed assets in generating sales. For example, in Year 2 Starbucks earned $4.32 of sales for every dollar of fixed assets, which is more than $3.56 of sales for every dollar of fixed assets it earned in Year 1. Thus, Starbucks used its fixed assets more efficiently in Year 2.
As illustrated on the prior page, the fixed asset turnover ratio can be compared across time for a single company. In addition, the ratio can be compared across companies. For example, the fixed asset turnover ratio for a number of different companies and industries is shown below.
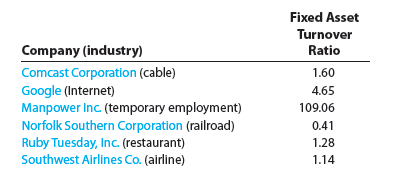
The smaller ratios are associated with companies that require large fixed asset investments. The larger fixed asset turnover ratios are associated with companies that are more labor-intensive and require smaller fixed asset investments.
Source: Warren Carl S., Reeve James M., Duchac Jonathan (2013), Corporate Financial Accounting, South-Western College Pub; 12th edition.
I’m still learning from you, but I’m improving myself. I definitely liked reading all that is written on your blog.Keep the information coming. I loved it!