There are times when respondents simply key in a value wrong or list an invalid response to an inquiry.To test if an answer is outside of an acceptable range, you need to go to your SPSS file, select the “Analyze” option at the top, and then select “Descriptive Statistics”. Next, you will select the “Descriptives” option.
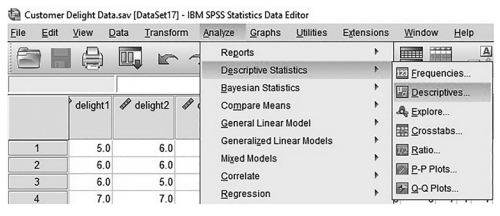
Figure 2.2 Descriptives in SPSS
After selecting “Descriptives”, a pop-up window will appear. Let’s say I want to see if any of my customer delight indicators have an impermissible value. I select all three indicators for analysis and move them into the “Variable(s)” field. I also want to select the “Options” button in order to see all the necessary fields. The “Options” window will give you lots of analysis choices. I like to see the Mean, Standard Deviation, and, most importantly, the Minimum and Maximum values to determine if a value is outside of an acceptable range.You can also examine if an indicator has a high degree of kurtosis or skewness on this options page. Once I have selected all my options, I hit the continue button and then hit the “OK” button on the main descriptives page.
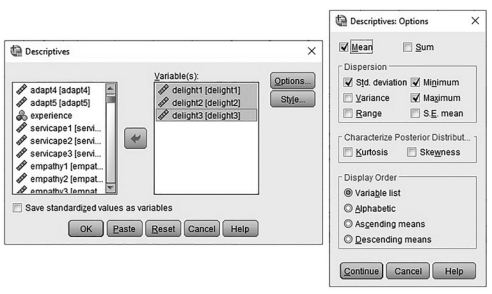
Figure 2.3 Descriptives Window With Options
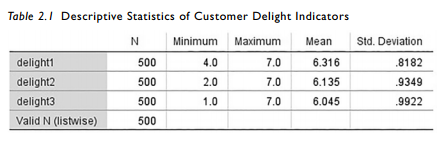
The descriptives output (listed below) lets you see the minimum and maximum value for each indicator. With all three indicators on a 7-point scale, the maximum value should not be below 1 or higher than 7. With some online survey companies, I have actually seen where data from the company is converted to other numbers. Instead of a 1 to 7 scale, the software changes the scale to a 14 to 20 scale.This is rare, but in the event something like this does hap- pen, you will know what analysis to use to catch this impermissible response.
With closed-ended questions where the respondent is making a choice (via Likert or Seman- tic Differential), you will rarely find that your responses are out of an appropriate range. The area you see this most frequently is with open-ended questions where the respondent inputs the data directly. For instance, lets say we perform the exact same analysis again but examine the “Age” of the respondents this time.
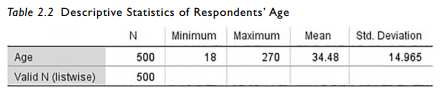
The results of the analysis show us the minimum age was 18 and maximum age was 270. Unless Dorian Gray was one of the respondents, the 270 record is most likely respondent error. Based on the mean, the respondent was probably 27 but could be 70. In this instance, it is better to delete the record and then impute the missing data. As stated earlier, this analysis will let you see if any of your values are outside of an accepted range. Failing to address this issue could significantly skew your data depending on the sample size.
Source: Thakkar, J.J. (2020). “Procedural Steps in Structural Equation Modelling”. In: Structural Equation Modelling. Studies in Systems, Decision and Control, vol 285. Springer, Singapore.
30 Mar 2023
30 Mar 2023
29 Mar 2023
27 Mar 2023
20 Sep 2022
29 Mar 2023