A fall in the price of a good has two effects:
- Consumers will tend to buy more of the good that has become cheaper and less of those goods that are now relatively more expensive. This response to a change in the relative prices of goods is called the substitu- tion
- Because one of the goods is now cheaper, consumers enjoy an increase in real purchasing power. They are better off because they can buy the same amount of the good for less money, and thus have money left over for additional purchases. The change in demand resulting from this change in real purchasing power is called the income effect.
Normally, these two effects occur simultaneously, but it will be useful to distinguish between them for purposes of analysis. The specifics are illustrated in Figure 4.6, where the initial budget line is RS and there are two goods, food and clothing. Here, the consumer maximizes utility by choosing the market basket at A, thereby obtaining the level of utility associated with the indiffer- ence curve U1.
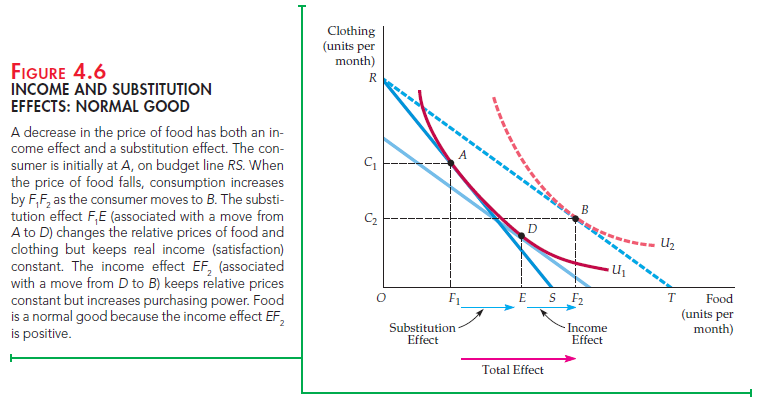
Now let’s see what happens if the price of food falls, causing the budget line to rotate outward to line RT. The consumer now chooses the market basket at B on indifference curve U2. Because market basket B was chosen even though market basket A was feasible, we know (from our discussion of revealed prefer- ence in Section 3.4) that B is preferred to A. Thus, the reduction in the price of food allows the consumer to increase her level of satisfaction—her purchasing
power has increased. The total change in the consumption of food caused by the lower price is given by F1F2. Initially, the consumer purchased OF1 units of food, but after the price change, food consumption has increased to OF2. Line segment F1F2, therefore, represents the increase in desired food purchases.
1. Substitution Effect
The drop in price has both a substitution effect and an income effect. The substitution effect is the change in food consumption associated with a change in the price of food, with the level of utility held constant. The substitution effect captures the change in food consumption that occurs as a result of the price change that makes food relatively cheaper than clothing. This substitution is marked by a movement along an indifference curve. In Figure 4.6, the substitution effect can be obtained by drawing a budget line which is parallel to the new budget line RT (reflecting the lower relative price of food), but which is just tangent to the original indifference curve U1 (holding the level of satisfaction constant). The new, lower imaginary budget line reflects the fact that nominal income was reduced in order to accomplish our conceptual goal of isolating the substitu-tion effect. Given that budget line, the consumer chooses market basket D and consumes OE units of food. The line segment F1E thus represents the substitu- tion effect.
Figure 4.6 makes it clear that when the price of food declines, the substitution effect always leads to an increase in the quantity of food demanded. The expla- nation lies in the fourth assumption about consumer preferences discussed in Section 3.1—namely, that indifference curves are convex. Thus, with the convex indifference curves shown in the figure, the point that maximizes satisfaction on the new imaginary budget line parallel to RT must lie below and to the right of the original point of tangency.
2. Income Effect
Now let’s consider the income effect: the change in food consumption brought about by the increase in purchasing power, with relative prices held constant. In Figure 4.6, we can see the income effect by moving from the imaginary budget line that passes through point D to the parallel budget line, RT, which passes through B. The consumer chooses market basket B on indifference curve U2 (because the lower price of food has increased her level of utility). The increase in food consumption from OE to OF2 is the measure of the income effect, which is positive, because food is a normal good (consumers will buy more of it as their incomes increase). Because it reflects a movement from one indifference curve to another, the income effect measures the change in the consumer’s purchasing power.
We have seen in Figure 4.6 that the total effect of a change in price is given theoretically by the sum of the substitution effect and the income effect:
Total Effect (F1F2) = Substitution Effect (F1E) + Income Effect (EF2)
Recall that the direction of the substitution effect is always the same: A decline in price leads to an increase in consumption of the good. However, the income effect can move demand in either direction, depending on whether the good is normal or inferior.
A good is inferior when the income effect is negative: As income rises, con- sumption falls. Figure 4.7 shows income and substitution effects for an inferior good. The negative income effect is measured by line segment EF2. Even with inferior goods, the income effect is rarely large enough to outweigh the substitution effect. As a result, when the price of an inferior good falls, its consumption almost always increases.
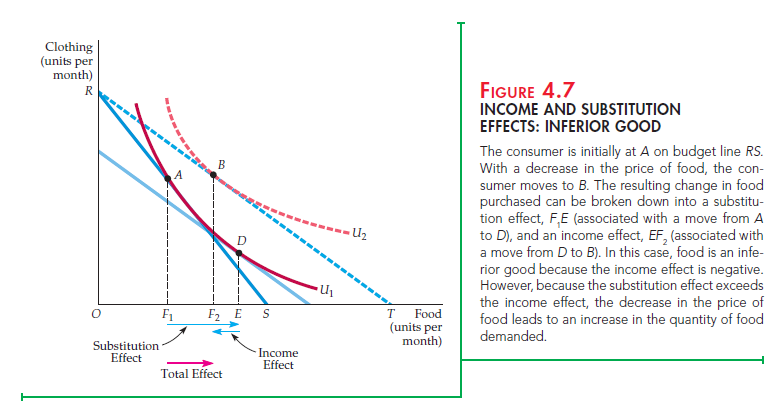
inferior goods, the income effect is rarely large enough to outweigh the substitu- tion effect. As a result, when the price of an inferior good falls, its consumption almost always increases.
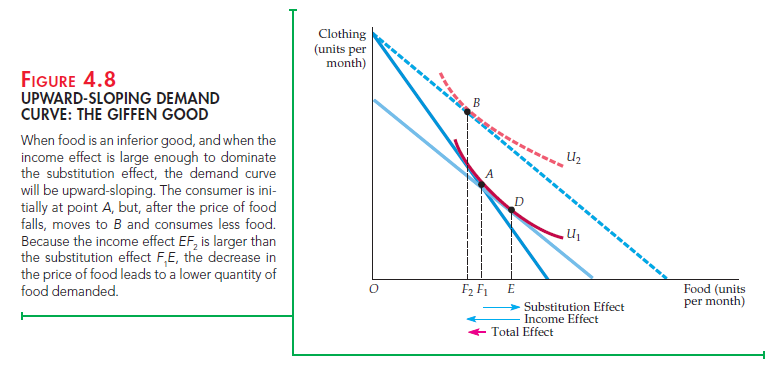
3. A Special Case: The Giffen Good
Theoretically, the income effect may be large enough to cause the demand curve for a good to slope upward. We call such a good a Giffen good, and Figure 4.8 shows its income and substitution effects. Initially, the consumer is at A, consuming relatively little clothing and much food. Now the price of food declines. The decline in the price of food frees enough income so that the consumer desires to buy more clothing and fewer units of food, as illustrated by B. Revealed preference tells us that the consumer is better off at B rather than A even though less food is consumed.
Though intriguing, the Giffen good is rarely of practical interest because it requires a large negative income effect. But the income effect is usually small: Individually, most goods account for only a small part of a consumer ’s budget. Large income effects are often associated with normal rather than inferior goods (e.g., total spending on food or housing).
Source: Pindyck Robert, Rubinfeld Daniel (2012), Microeconomics, Pearson, 8th edition.
There is definately a great deal to find out about this
subject. I really like all the points you’ve made.
What a information of un-ambiguity and preserveness of valuable know-how about unexpected feelings.