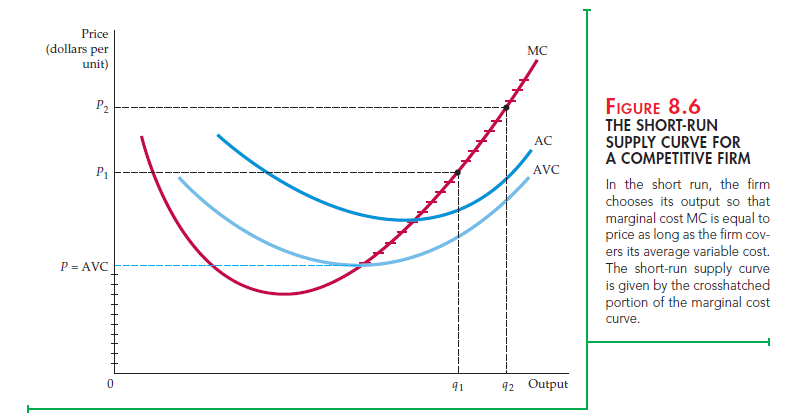
A supply curve for a firm tells us how much output it will produce at every pos- sible price. We have seen that competitive firms will increase output to the point at which price is equal to marginal cost, but will shut down if price is below average variable cost. Therefore, the firm’s supply curve is the portion of the mar- ginal cost curve for which marginal cost is greater than average variable cost.
Figure 8.6 illustrates the short-run supply curve. Note that for any P greater than minimum AVC, the profit-maximizing output can be read directly from the graph. At a price P1, for example, the quantity supplied will be q1; and at P2, it will be q2. For P less than (or equal to) minimum AVC, the profit-maximizing output is equal to zero. In Figure 8.6 the entire short-run supply curve consists of the crosshatched portion of the vertical axis plus the marginal cost curve above the point of minimum average variable cost.
Short-run supply curves for competitive firms slope upward for the same rea- son that marginal cost increases—the presence of diminishing marginal returns to one or more factors of production. As a result, an increase in the market price will induce those firms already in the market to increase the quantities they produce.

The higher price not only makes the additional production profitable, but also increases the firm’s total profit because it applies to all units that the firm produces.
The Firm’s Response to an Input Price Change
When the price of its product changes, the firm changes its output level to ensure that marginal cost of production remains equal to price. Often, however, the product price changes at the same time that the prices of inputs change. In this section we show how the firm’s output decision changes in response to a change in the price of one of its inputs.
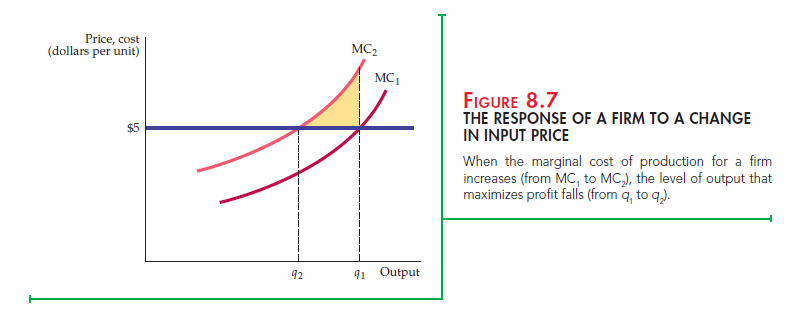
Figure 8.7 shows a firm’s marginal cost curve that is initially given by MC1 when the firm faces a price of $5 for its product. The firm maximizes profit by producing an output of q1. Now suppose the price of one input increases. Because it now costs more to produce each unit of output, this increase causes the marginal cost curve to shift upward from MC1 to MC2. The new profit-maximizing output is q2, at which P = MC2. Thus, the higher input price causes the firm to reduce its output.

If the firm had continued to produce q1, it would have incurred a loss on the last unit of production. In fact, all production beyond q2 would reduce profit.
Source: Pindyck Robert, Rubinfeld Daniel (2012), Microeconomics, Pearson, 8th edition.

F*ckin¦ awesome issues here. I¦m very satisfied to see your post. Thank you a lot and i am having a look ahead to contact you. Will you please drop me a e-mail?