In Problem 6.5, we will use the backward approach, which is when all the variables are added into the model, then are eliminated one by one, with the variable that has the largest probability of F (i.e., p value) removed until all variables have a p value equal to or less than .10. The backward approach enables the researcher to produce a model with the fewest predicators. This approach is an appropriate method to use when the researcher has numerous variables of interest and wants to have a model that is as parsimonious (i.e., most simple with the fewest predictors) as possible. In our example, we will compute a backward regression to find the most parsimonious model for parents’ education, competence, pleasure, mosaic, math achievement, and scholastic aptitude test.
6.5 What is the most parsimonious combination of parents’ education, competence, pleasure, mosaic, and math achievement in predicting scholastic aptitude test?
- Click on the following: Analyze → Regression → Linear…
- Click on Reset.
- Select scholastic aptitude test-math and click it over to the Dependent box (dependent variable).
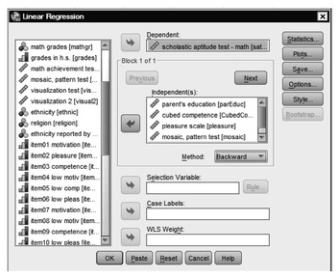
- Next, move parents’ education, cubed competence, pleasure, mosaic, and math achievement to the Independent(s) box (independent variables).
- Select Backward as your Method (see 6.7).
Fig. 6.7. Backward linear regression.
- Click on Statistics, click on Estimates (under Regression Coefficients), and click on Descriptive, Model fit, R squared change, and Collinearity diagnostics. (See 6.2.)
- Click on Continue.
- Click on OK.
Compare your output and syntax to Output 6.5.
REGRESSION
/DESCRIPTIVES MEAN STDDEV CORR SIG N
/MISSING LISTWISE
/STATISTICS COEFF OUTS R ANOVA COLLIN TOL CHANGE
/CRITERIA=PIN(.05) POUT(.10)
/NOORIGIN
/DEPENDENT satm
/METHOD=BACKWARD parEduc CubedComp pleasure mosaic mathach.
Regression


Interpretation of Output 6.5
First, the output provides the Descriptive Statistics for all six variables. Note that N is 73 because two participants are missing a score on one or more variables.
The next table is a correlation matrix. Note that only math achievement would be statistically significantly correlated with scholastic aptitude test – math with a two-tailed test. This is okay as we are interested in the combination of all the variables and how they relate to the outcome variable.
We checked all the assumptions, but did not include the output here due to space concerns. All assumptions for multiple regression were met.


Source: Leech Nancy L. (2014), IBM SPSS for Intermediate Statistics, Routledge; 5th edition;
download Datasets and Materials.
14 Sep 2022
16 Sep 2022
28 Mar 2023
27 Mar 2023
15 Sep 2022
14 Sep 2022