In the early twentieth century, quality control practices were limited to inspecting finished products and removing defective items. But this all changed as the result of the pioneering efforts of a young engineer named Walter A. Shewhart. After completing his doctorate in physics from the University of California in 1917, Dr. Shewhart joined the Western Electric Company, working in the inspection engineering department. In 1924 Dr. Shewhart prepared a memorandum that included a set of principles that are the basis for what is known today as process control. And his memo also contained a diagram that would be recognized as a statistical control chart. Continuing his work in quality at Bell Telephone Laboratories until his retirement in 1956, he brought together the disciplines of statistics, engineering, and economics and in doing so changed the course of industrial history. Dr. Shewhart is recognized as the father of statistical quality control and was the first honorary member of the ASQ.
Two other individuals who have had great influence on quality are Dr. W. Edwards Deming, a student of Dr. Shewhart, and Joseph Juran. These men helped educate the Japanese in quality management shortly after World War II. Although quality is everybody’s job, Deming stressed that the focus on quality must be led by managers. He developed a list of 14 points that he believed represent the key responsibilities of managers. For instance, Deming stated that managers must cease dependence on mass inspection; must end the practice of awarding business solely on the basis of price; must seek continual improvement in all production processes and service; must foster a team-oriented environment; and must eliminate goals, slogans, and work standards that prescribe numerical quotas. Perhaps most important, managers must create a work environment in which a commitment to quality and productivity is maintained at all times.
Juran proposed a simple definition of quality: fitness for use. Juran’s approach to quality focused on three quality processes: quality planning, quality control, and quality improvement. In contrast to Deming’s philosophy, which required a major cultural change in the organization, Juran’s programs were designed to improve quality by working within the current organizational system. Nonetheless, the two philosophies are similar in that they both focus on the need for top management to be involved and stress the need for continuous improvement, the importance of training, and the use of quality control techniques.
Many other individuals played significant roles in the quality movement, including Philip B. Crosby, A. V. Feigenbaum, Karou Ishikawa, and Genichi Taguchi. More specialized texts dealing exclusively with quality provide details of the contributions of each of these individuals. The contributions of all individuals involved in the quality movement helped define a set of best practices and led to numerous awards and certification programs. Some of the most significant quality-management programs are the U.S. Malcolm Baldrige National Quality Award, the international ISO 9000 certification process, and Six Sigma methodologies.
1. Malcolm Baldrige National Quality Award
The Malcolm Baldrige National Quality Award is given by the president of the United States to organizations that apply and are judged to be outstanding in seven areas: leadership; strategy; customers; measurement, analysis, and knowledge management; workforce; operations; and results. Congress established the award program in 1987 to recognize U.S. organizations for their achievements in quality and performance and to raise awareness about the importance of quality as a competitive edge. The award is named for Malcolm Baldrige, who served as secretary of commerce from 1981 until his death in 1987.
Since the presentation of the first awards in 1988, the Baldrige National Quality Program (BNQP) has grown in stature and impact. More than 4 million copies of the criteria have been distributed since 1988. Bob Barnett, executive vice president of Motorola, Inc., said, “We applied for the Award, not with the idea of winning, but with the goal of receiving the evaluation of the Baldrige Examiners. That evaluation was comprehensive, professional, and insightful . . . making it perhaps the most cost-effective, value-added business consultation available anywhere in the world today.”
2. ISO 9000
ISO 9000 is a series of five international standards published in 1987 by the International Organization for Standardization (ISO), Geneva, Switzerland. Companies can use the standards to help determine what is needed to maintain an efficient quality conformance system. For example, the standards describe the need for an effective quality system, for ensuring that measuring and testing equipment is calibrated regularly, and for maintaining an adequate record-keeping system. ISO 9000 registration determines whether a company complies with its own quality system. Overall, ISO 9000 registration covers less than 10% of the Baldrige Award criteria.
3. Six Sigma
In the late 1980s Motorola recognized the need to improve the quality of its products and services; their goal was to achieve a level of quality so good that for every million opportunities no more than 3.4 defects will occur. This level of quality is referred to as the six sigma level of quality, and the methodology created to reach this quality goal is referred to as Six Sigma.
An organization may undertake two kinds of Six Sigma projects:
- DMAIC (Define, Measure, Analyze, Improve, and Control) to help redesign existing processes
- DFSS (Design for Six Sigma) to design new products, processes, or services
In helping to redesign existing processes and design new processes, Six Sigma places a heavy emphasis on statistical analysis and careful measurement. Today, Six Sigma is a major tool in helping organizations achieve Baldrige levels of business performance and process quality. Many Baldrige examiners view Six Sigma as the ideal approach for implementing Baldrige improvement programs.
Six Sigma Limits and Defects Per Million Opportunities In Six Sigma terminology, a defect is any mistake or error that is passed on to the customer. The Six Sigma process defines quality performance as defects per million opportunities (dpmo). Six Sigma represents a quality level of at most 3.4 dpmo. To illustrate how this quality level is measured, let us consider the situation at KJW Packaging.
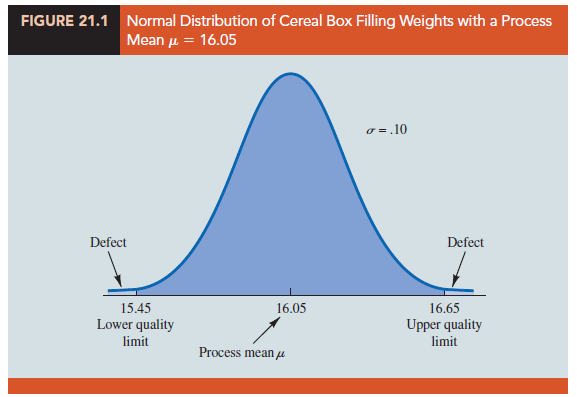
KJW operates a production line where boxes of cereal are filled. The filling process has a mean of μ = 16.05 ounces and a standard deviation of σ = .10 ounces. It is reasonable to assume the filling weights are normally distributed. The distribution of filling weights is shown in Figure 21.1. Suppose management considers 15.45 to 16.65 ounces to be acceptable quality limits for the filling process. Thus, any box of cereal that contains less than 15.45 or more than 16.65 ounces is considered to be a defect. Using Excel, it can be shown that 99.9999998% of the boxes filled will have between 16.05 – 6(.10) = 15.45 ounces and 16.05 + 6(.10) = 16.65 ounces. In other words, only .0000002% of the boxes filled will contain less than 15.45 ounces or more than 16.65 ounces. Thus, the likelihood of obtaining a defective box of cereal from the filling process appears to be extremely unlikely, because on average only two boxes in 10 million will be defective.
Motorola’s early work on Six Sigma convinced them that a process mean can shift on average by as much as 1.5 standard deviations. For instance, suppose that the process mean for KJW increases by 1.5 standard deviations or 1.5(.10) = .15 ounces. With such a shift, the normal distribution of filling weights would now be centered at μ = 16.05 + .15 = 16.20 ounces. With a process mean of μ = 16.05 ounces, the probability of obtaining a box of cereal with more than 16.65 ounces is extremely small. But how does this probability change if the mean of the process shifts up to μ = 16.20 ounces? Figure 21.2 shows that for this case, the upper quality limit of 16.65 is 4.5 standard deviations to the right of the new mean μ = 16.20 ounces. Using this mean and Excel, we find that the probability of obtaining a box with more than 16.65 ounces is .0000034. Thus, if the process mean shifts up by 1.5 standard deviations, approximately 1,000,000(.0000034) = 3.4 boxes of cereal will exceed the upper limit of 16.65 ounces. In Six Sigma terminology, the quality level of the process is said to be 3.4 defects per million opportunities. If management of KJW considers 15.45 to 16.65 ounces to be acceptable quality limits for the filling process, the KJW filling process would be considered a Six Sigma process. Thus, if the process mean stays within 1.5 standard deviations of its target value m = 16.05 ounces, a maximum of only 3.4 defects per million boxes filled can be expected.
Organizations that want to achieve and maintain a Six Sigma level of quality must emphasize methods for monitoring and maintaining quality. Quality assurance refers to the entire system of policies, procedures, and guidelines established by an organization to achieve and maintain quality. Quality assurance consists of two principal functions: quality engineering and quality control. The object of quality engineering is to include quality in the design of products and processes and to identify quality problems prior to production. Quality control consists of a series of inspections and measurements used to determine whether quality standards are being met. If quality standards are not being met, corrective or preventive action can be taken to achieve and maintain conformance. In the next two sections, we present two statistical methods used in quality control. The first method, statistical process control, uses graphical displays known as control charts to monitor a process; the goal is to determine whether the process can be continued or whether corrective action should be taken to achieve a desired quality level. The second method, acceptance sampling, is used in situations where a decision to accept or reject a group of items must be based on the quality found in a sample.

4. Quality in the Service Sector
While its roots are in manufacturing, quality control is also very important for businesses that focus primarily on providing services. Examples of businesses that are primarily involved in providing services are health care providers, law firms, hotels, airlines, restaurants, and banks. Businesses focused on providing services are a very important part of the U.S. economy. In fact, the vast majority of nonfarming employees in the United States are engaged in providing services.
Rather than a focus on measuring defects in a production process, quality efforts in the service sector focus on ensuring customer satisfaction and improving the customer experience. Because it is generally much less costly to retain a customer than it is to acquire a new one, quality control processes that are designed to improve customer service are critical to a service business. Customer satisfaction is the key to success in any service-oriented business.
Service businesses are very different from manufacturing businesses and this has an impact on how quality is measured and ensured. Services provided are often intangible (e.g., advice from a residence hall adviser). Because customer satisfaction is very subjective, it can be challenging to measure quality in services. However, quality can be monitored by measuring such things as timeliness of providing service as well as by conducting customer satisfaction surveys. This is why some dry cleaners guarantee one-hour service and why automobile service centers, airlines, and restaurants ask you to fill out a survey about your service experience. It is also why businesses use customer loyalty cards.
By tracking your buying behavior, they can better understand the wants and needs of their customers and consequently provide better service.
Quality management in health care services has become increasingly important. Many errors that occur in hospitals and clinics are preventable. Medical errors lead to excessive costs and can lead to negative outcomes for patients. Health care administrators have begun to focus on quality management programs to improve patient outcomes and reduce costs in health care.
Source: Anderson David R., Sweeney Dennis J., Williams Thomas A. (2019), Statistics for Business & Economics, Cengage Learning; 14th edition.
30 Aug 2021
30 Aug 2021
31 Aug 2021
30 Aug 2021
30 Aug 2021
30 Aug 2021