In this section we show how to conduct a hypothesis test about a population proportion p. Using p0 to denote the hypothesized value for the population proportion, the three forms for a hypothesis test about a population proportion are as follows.

The first form is called a lower tail test, the second form is called an upper tail test, and the third form is called a two-tailed test.
Hypothesis tests about a population proportion are based on the difference between the sample proportion P and the hypothesized population proportion P0. The methods used to conduct the hypothesis test are similar to those used for hypothesis tests about a population mean. The only difference is that we use the sample proportion and its standard error to compute the test statistic. The P-value approach or the critical value approach is then used to determine whether the null hypothesis should be rejected.
Let us consider an example involving a situation faced by Pine Creek golf course. Over the past year, 20% of the players at Pine Creek were women. In an effort to increase the proportion of women players, Pine Creek implemented a special promotion designed to attract women golfers. One month after the promotion was implemented, the course manager requested a statistical study to determine whether the proportion of women players at Pine Creek had increased. Because the objective of the study is to determine whether the proportion of women golfers increased, an upper tail test with Ha: P > .20 is appropriate. The null and alternative hypotheses for the Pine Creek hypothesis test are as follows:

If H0 can be rejected, the test results will give statistical support for the conclusion that the proportion of women golfers increased and the promotion was beneficial. The course manager specified that a level of significance of a = .05 be used in carrying out this hypothesis test.
The next step of the hypothesis testing procedure is to select a sample and compute the value of an appropriate test statistic. To show how this step is done for the Pine Creek upper tail test, we begin with a general discussion of how to compute the value of the test statistic for any form of a hypothesis test about a population proportion. The sampling distribution of P, the point estimator of the population parameter P, is the basis for developing the test statistic.
When the null hypothesis is true as an equality, the expected value of P equals the hypothesized value P0; that is, E( P) = P0. The standard error of P is given by

In Chapter 7 we said that if nP > 5 and n(1 – p) > 5, the sampling distribution of P can be approximated by a normal distribution.3 Under these conditions, which usually apply in practice, the quantity

has a standard normal probability distribution. With sp = Vp0(1 – P0)/n, the standard normal random variable z is the test statistic used to conduct hypothesis tests about a population proportion.

We can now compute the test statistic for the Pine Creek hypothesis test. Suppose a random sample of 400 players was selected, and that 100 of the players were women. The proportion of women golfers in the sample is

Using equation (9.4), the value of the test statistic is
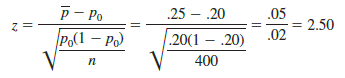
Because the Pine Creek hypothesis test is an upper tail test, the P-value is the probability that z is greater than or equal to z = 2.50; that is, it is the upper tail area corresponding to z > 2.50. Using the standard normal probability table, we find that the area to the left of z = 2.50 is .9938. Thus, the P-value for the Pine Creek test is 1.0000 – .9938 = .0062. Figure 9.7 shows this P-value calculation.
Recall that the course manager specified a level of significance of a = .05. A P-value = .0062 < .05 gives sufficient statistical evidence to reject H0 at the .05 level of significance. Thus, the test provides statistical support for the conclusion that the special promotion increased the proportion of women players at the Pine Creek golf course.
The decision whether to reject the null hypothesis can also be made using the critical value approach. The critical value corresponding to an area of .05 in the upper tail of a normal probability distribution is z.05 = 1.645. Thus, the rejection rule using the critical value approach is to reject H0 if z ^ 1.645. Because z = 2.50 > 1.645, H0 is rejected.
Again, we see that the P-value approach and the critical value approach lead to the same hypothesis testing conclusion, but the P-value approach provides more information. With a P-value = .0062, the null hypothesis would be rejected for any level of significance greater than or equal to .0062.

Source: Anderson David R., Sweeney Dennis J., Williams Thomas A. (2019), Statistics for Business & Economics, Cengage Learning; 14th edition.
30 Aug 2021
30 Aug 2021
28 Aug 2021
30 Aug 2021
30 Aug 2021
30 Aug 2021