In Chapter 10, we introduced a matched-sample experimental design where each of n experimental units provided a pair of observations, one from population 1 and one from population 2. The parametric test for this experiment requires quantitative data and the assumption that the differences between the paired observations are normally distributed. The t distribution can then be used to make an inference about the difference between the means of the two populations.
The Wilcoxon signed-rank test is a nonparametric procedure for analyzing data from a matched-sample experiment. The test uses quantitative data but does not require the assumption that the differences between the paired observations are normally distributed.
It only requires the assumption that the differences between the paired observations have a symmetric distribution. This occurs whenever the shapes of the two populations are the same and the focus is on determining if there is a difference between the medians of the two populations. Let us demonstrate the Wilcoxon signed-rank test with the following example.
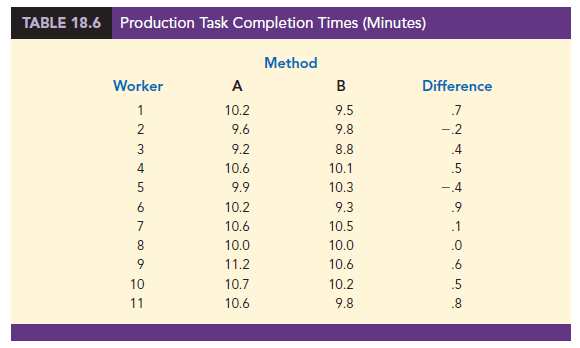
Consider a manufacturing firm that is attempting to determine whether two production methods differ in terms of task completion time. Using a matched-samples experimental design, 11 randomly selected workers completed the production task two times, once using method A and once using method B. The production method that the worker used first was randomly selected. The completion times for the two methods and the differences between the completion times are shown in Table 18.6. A positive difference indicates that method A required more time; a negative difference indicates that method B required more time. Do the data indicate that the two production methods differ significantly in terms of completion times? If we assume that the differences have a symmetric distribution but not necessarily a normal distribution, the Wilcoxon signed- rank test applies.
In particular, we will use the Wilcoxon signed-rank test for the difference between the median completion times for the two production methods. The hypotheses are as follows:
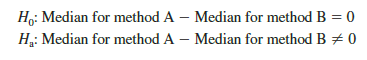
If H0 cannot be rejected, we will not be able to conclude that the median completion times are different. However, if H0 is rejected, we will conclude that the median completion times are different. We will use a .05 level of significance for the test.
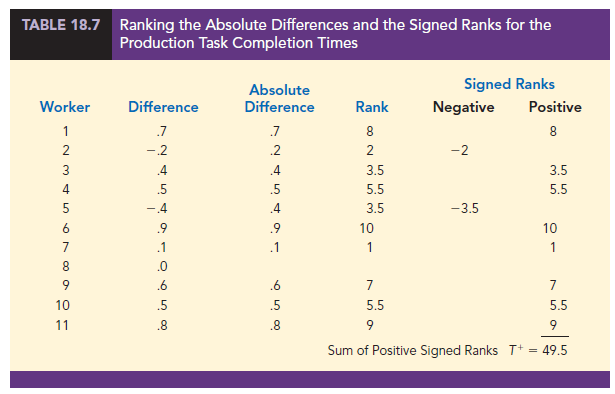
The first step in the Wilcoxon signed-rank test is to discard the difference of zero for worker 8 and then compute the absolute value of the differences for the remaining 10 workers as shown in column 3 of Table 18.7. Next we rank these absolute differences from lowest to highest as shown in column 4. The smallest absolute difference of .1 for worker 7 is assigned the rank of 1. The second smallest absolute difference of .2 for worker 2 is assigned the rank of 2. This ranking of absolute differences continues with the largest absolute difference of .9 for worker 6 being assigned the rank of 10.
The tied absolute differences of .4 for workers 3 and 5 are assigned the average rank of 3.5. Similarly, the tied absolute differences of .5 for workers 4 and 10 are assigned the average rank of 5.5.
Once the ranks of the absolute differences have been determined, each rank is given the sign of the original difference for the worker. The negative signed ranks are placed in column 5 and the positive signed ranks are placed in column 6 (see Table 18.7). For example, the difference for worker 1 was a positive .7 (see column 2) and the rank of the absolute difference was 8 (see column 4). Thus, the rank for worker 1 is shown as a positive signed rank in column 6. The difference for worker 2 was a negative .2 and the rank of the absolute difference was 2. Thus, the rank for worker 2 is shown as a negative signed rank of -2 in column 5. Continuing this process generates the negative and positive signed ranks as shown in Table 18.7.
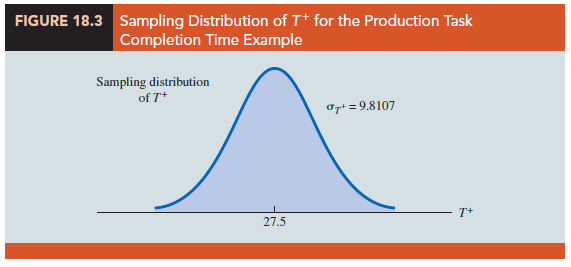
Let T+ denote the sum of the positive signed ranks, which is T+ = 49.5. To conduct the Wilcoxon signed-rank test, we will use T + as the test statistic. If the medians of the two populations are equal and the number of matched pairs is 10 or more, the sampling distribution of T + can be approximated by a normal distribution shown in equations (18.3) and (18.4).
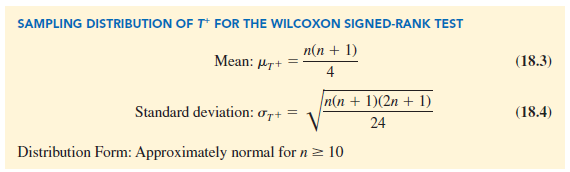
After discarding the observation of a zero difference for worker 8, the analysis continues with the n = 10 matched pairs. Using equations (18.3) and (18.4), we have
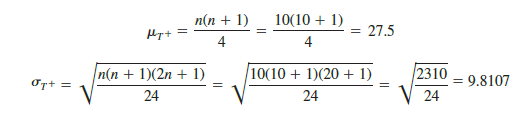
Figure 18.3 shows the sampling distribution of the T + test statistic.
Let us compute the two-tailed p-value for the hypothesis that the median completion times for the two production methods are equal. Since the test statistic T += 49.5 is in the upper tail of the sampling distribution, we begin by computing the upper tail probability P(T + > 49.5). Since the sum of the positive ranks T + is discrete and the normal distribution is continuous, we will obtain the best approximation by including the continuity correction factor. Thus, the discrete probability of T += 49.5 is approximated by the normal probability interval, 49 to 50, and the probability that T + > 49.5 is approximated by:
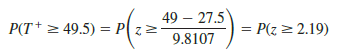
Using the standard normal distribution table and z = 2.19, we see that the two-tailed p-value = 2(1-.9857) = .0286. With thep-value < .05, we reject H0 and conclude that the median completion times for the two production methods are not equal. With T + being in the upper tail of the sampling distribution, we see that method A led to the longer completion times. We would expect management to conclude that method B is the faster or better production method.
One-tailed Wilcoxon signed-rank tests are possible. For example, if initially we had been looking for statistical evidence to conclude method A had the larger median completion time and method B has the smaller median completion time, we would have formulated an upper tail hypothesis test as follows:
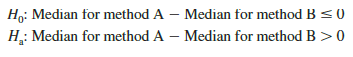
Rejecting H0 would provide the conclusion that method A has the greater median completion time and method B has the smaller median completion time. Lower tail hypothesis tests are also possible.
As a final note, in Section 18.1 we showed how the sign test could be used for both a hypothesis test about a population median and a hypothesis test with matched samples. In this section, we have demonstrated the use of the Wilcoxon signed-rank test for a hypothesis test with matched samples. However, the Wilcoxon signed-rank test can also be used for a nonparametric test about a population median. This test makes no assumption about the population distribution other than that it is symmetric. If this assumption is appropriate, the Wilcoxon signed-rank test is the preferred nonparametric test for a population median. However, if the population is skewed, the sign test presented in Section 18.1 is preferred. With the Wilcoxon signed-rank test, the differences between the observations and the hypothesized value of the population median are used instead of the differences between the matched-pair observations. Otherwise the calculations are exactly as shown in this section. Exercise 17 will ask you to use the Wilcoxon signed-rank test to conduct a hypothesis test about the median of a symmetric population.
Source: Anderson David R., Sweeney Dennis J., Williams Thomas A. (2019), Statistics for Business & Economics, Cengage Learning; 14th edition.
31 Aug 2021
28 Aug 2021
30 Aug 2021
28 Aug 2021
28 Aug 2021
30 Aug 2021