Government production of a public good is advantageous because the government can assess taxes or fees to pay for it. But how can government determine how much of a public good to provide when the free rider problem gives people an incentive to misrepresent their preferences? In this section we discuss one mechanism for determining private preferences for government-produced goods.
Voting is commonly used to decide allocation questions. For example, people vote directly on some local budget issues and elect legislators who vote on others. Many state and local referenda are based on majority-rule voting: Each person has one vote, and the candidate or the issue that receives more than 50 percent of the votes wins. Let’s see how majority-rule voting determines the provision of public education. Figure 18.15 describes the preferences for spending on education (on a per-pupil basis) of three citizens who are representative of three interest groups in the school district.
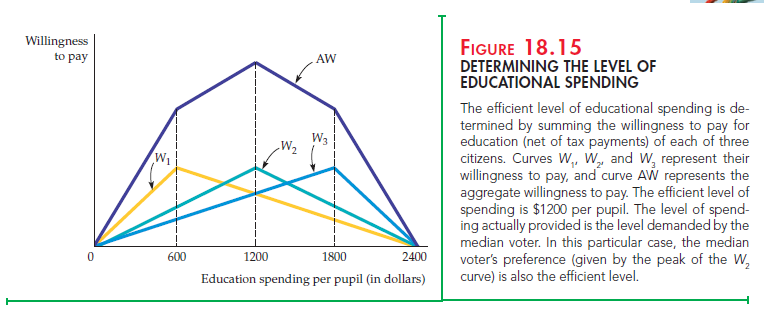
Curve W1 gives the first citizen’s willingness to pay for education, minus any required tax payments. The willingness to pay for each spending level is the maximum amount of money the citizen will pay to enjoy that spending level rather than no spending at all.26 In general, the benefit from increased spending on education increases as spending increases. But the tax payments required to pay for that education increase as well. The willingness-to-pay curve, which represents the net benefit of educational spending, initially slopes upward because the citizen places great value on low spending levels. When spending increases beyond $600 per pupil, however, the value that the household puts on education increases at a diminishing rate. The net benefit, therefore, actually declines. Eventually, the spending level becomes so great (at $2400 per pupil) that the citizen is indifferent between this level of spending and no spending at all.
Curve W2, which represents the second citizen’s willingness to pay (net of taxes) is similarly shaped but reaches its maximum at a spending level of $1200 per pupil. Finally, W3, the willingness to pay of the third citizen, peaks at $1800 per pupil.
The dark line labeled AW represents the aggregate willingness to pay for education—the vertical summation of the W1, W2, and W3 curves. The AW curve measures the maximum amount that all three citizens are willing to pay to enjoy each spending level. As Figure 18.15 shows, the aggregate willingness to pay is maximized when $1200 per pupil is spent. Because the AW curve measures the benefit of spending net of the tax payments required to pay for that spending, the maximum point, $1200 per pupil, also represents the efficient level of spending.
Will majority-rule voting achieve the efficient outcome in this case? Suppose the public must vote whether to spend $1200 or $600 per pupil. The first citizen will vote for $600, but the other two citizens will vote for $1200, which will then have been chosen by majority rule. In fact, $1200 per pupil will beat any other alternative in a majority-rule vote. Thus, $1200 represents the most preferred alternative of the median voter—the citizen with the median or middle preference. (The first citizen prefers $600 and the third $1800.) Under majority rule voting, the preferred spending level of the median voter will always win an election against any other alternative.
But will the preference of the median voter be the efficient level of spending? In this case yes, because $1200 is efficient. But the preference of the median voter is often not the efficient spending level. Suppose the third citizen’s preferences were the same as the second’s. In that case, although the median voter’s choice would still be $1200 per pupil, the efficient level of spending would be less than $1200 (because the efficient level involves an average of the preferences of all three citizens). In this case, majority rule would lead to too much spending on education. If we reversed the example so that the first and second citizens’ preferences were identical, majority rule would generate too little educational spending.
Thus, although majority-rule voting allows the preferences of the median voter to determine referenda outcomes, these outcomes need not be economically efficient. Majority rule is inefficient because it weighs each citizen’s preference equally: The efficient outcome weighs each citizen’s vote by his or her strength of preference.
Source: Pindyck Robert, Rubinfeld Daniel (2012), Microeconomics, Pearson, 8th edition.
Hi, Neat post. There’s a problem along with your site in internet explorer, may check thisK IE still is the marketplace chief and a large element of other people will pass over your magnificent writing because of this problem.