A profit-and-loss (income) statement is a summary of a retailer’s revenues and expenses over a given period of time, usually a month, quarter, or year. It lets the firm review overall and specific revenues and costs for similar periods (such as January 1, 2016, to December 31, 2016, versus January 1, 2015, to December 31, 2015) and analyze profits. With frequent statements, a firm can monitor progress on goals, update performance estimates, and revise strategies and tactics.
In comparing profit-and-loss performance over time, it is crucial that the same time periods be used (such as the third quarter of 2016 compared with the third quarter of 2015) due to seasonality. Some fiscal years may have an unequal number of weeks (53 weeks one year versus 51 weeks another). Retailers that open new stores or expand existing stores between accounting periods should also take into account the larger facilities. Yearly results should reflect total revenue growth and the rise in same-store sales.
A profit-and-loss statement consists of several major components:
- Net sales The revenues received by a retailer during a given period after deducting customer returns, markdowns, and employee discounts.
- Cost of goods sold The amount a retailer pays to acquire the merchandise sold during a given time period. It is based on purchase prices and freight charges, less all discounts (such as quantity, cash, and promotion).
- Gross profit (margin) The difference between net sales and the cost of goods sold. It consists of operating expenses plus net profit.
- Operating expenses The cost of running a retail business.
- Taxes The portion of revenues turned over to the federal, state, and/or local government.
- Net profit after taxes The profit earned after all costs and taxes have been deducted.
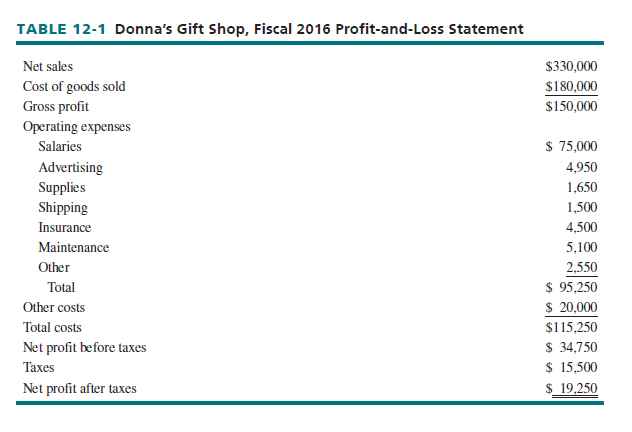
Table 12-1 shows the most recent annual profit-and-loss statement for Donna’s Gift Shop, an independent retailer. The firm uses a fiscal year (September 1 to August 31) rather than a calendar year in preparing its accounting reports. These observations can be drawn from the table:
- Annual net sales were $330,000—after deducting returns, markdowns on the items sold, and employee discounts from total sales.
- The cost of goods sold was $ 180,000, computed by taking the total purchases for merchandise sold, adding freight, and subtracting quantity, cash, and promotion discounts.
- Gross profit was $150,000, calculated by subtracting the cost of goods sold from net sales. This went for operating and other expenses, taxes, and profit.
- Operating expenses totaled $95,250, including salaries, advertising, supplies, shipping, insurance, maintenance, and other expenses.
- Unassigned costs were $20,000.
- Net profit before taxes was $34,750, computed by deducting total costs from gross profit. The tax bill was $15,500, leaving a net profit after taxes of $19,250.

Overall, fiscal 2016 was pretty good for Donna; her personal salary was $43,000 and the store’s after-tax profit was $19,250. A further analysis of Donna’s Gift Shop’s profit-and-loss statement appears in the budgeting section of this chapter.
Source: Barry Berman, Joel R Evans, Patrali Chatterjee (2017), Retail Management: A Strategic Approach, Pearson; 13th edition.

A person necessarily help to make severely articles I might state. That is the first time I frequented your website page and thus far? I amazed with the research you made to make this particular publish extraordinary. Wonderful task!