The Pearson product moment correlation coefficient introduced in Chapter 3 is a measure of the linear association between two variables using quantitative data. In this section, we provide a correlation measure of association between two variables when ordinal or rank-ordered data are available. The Spearman rank-correlation coefficient has been developed for this purpose.
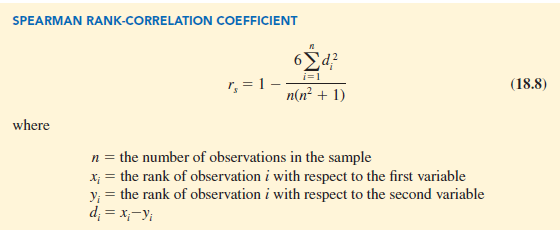
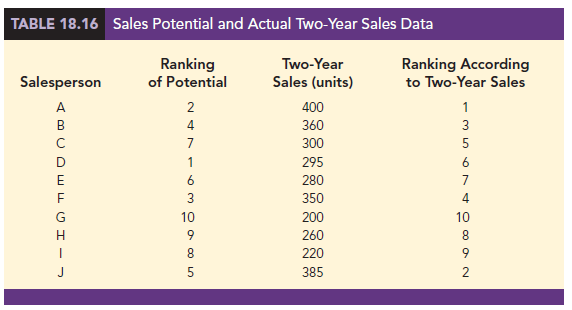
Let us illustrate the use of the Spearman rank-correlation coefficient. A company wants to determine whether individuals who had a greater potential at the time of employment turn out to have higher sales records. To investigate, the personnel director reviewed the original job interview reports, academic records, and letters of recommendation for 10 current members of the sales force. After the review, the director ranked the 10 individuals in terms of their potential for success at the time of employment and assigned the individual who had the most potential the rank of 1. Data were then collected on the actual sales for each individual during their first two years of employment. On the basis of the actual sales records, a second ranking of the 10 individuals based on sales performance was obtained. Table 18.16 provides the ranks based on potential as well as the ranks based on the actual performance.
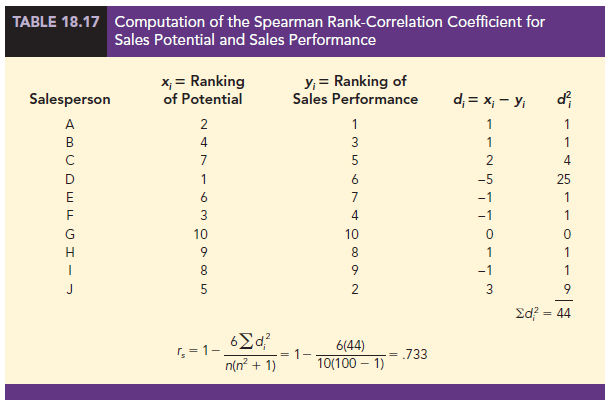
Let us compute the Spearman rank-correlation coefficient for the data in Table 18.16. The computations are summarized in Table 18.17. We first compute the difference between the two ranks for each salesperson, d, as shown in column 4. The sum of the d2 in column 5 is 44. This value and the sample size n = 10 are used to compute the rank-correlation coefficient rs = .733 shown in Table 18.17.
The Spearman rank-correlation coefficient ranges from -1.0 to +1.0 and its interpretation is similar to the Pearson product moment correlation coefficient for quantitative data. A rank-correlation coefficient near +1.0 indicates a strong positive association between the ranks for the two variables, while a rank-correlation coefficient near -1.0 indicates a strong negative association between the ranks for the two variables. A rank-correlation coefficient of 0 indicates no association between the ranks for the two variables. In the example, rs = .733 indicates a positive correlation between the ranks based on potential and the ranks based on sales performance. Individuals who ranked higher in potential at the time of employment tended to rank higher in two-year sales performance.
At this point, we may want to use the sample rank correlation rs to make an inference about the population rank correlation coefficient ps. To do this, we test the following hypotheses:

Under the assumption that the null hypothesis is true and the population rank-correlation coefficient is 0, the following sampling distribution of rs can be used to conduct the test.
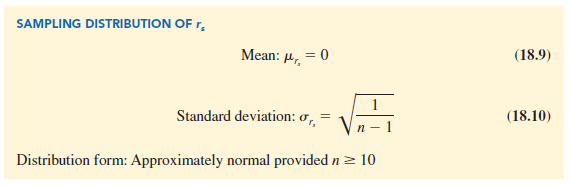
The sample rank-correlation coefficient for sales potential and sales performance is rs = .733. Using equation (18.9), we have mr = 0, and using equation (18.10), we have ![]() . With the sampling distribution of rs approximated by a normal distribution, the standard normal random variable z becomes the test statistic with
. With the sampling distribution of rs approximated by a normal distribution, the standard normal random variable z becomes the test statistic with
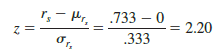
Using the standard normal probability table and z = 2.20, we find the two-tailed p-value = 2(1 – .9861) = .0278. With a .05 level of significance, p-value < a. Thus, we reject the null hypothesis that the population rank-correlation coefficient is zero. The test result shows that there is a significant rank correlation between potential at the time of employment and actual sales performance.
Source: Anderson David R., Sweeney Dennis J., Williams Thomas A. (2019), Statistics for Business & Economics, Cengage Learning; 14th edition.
30 Aug 2021
31 Aug 2021
31 Aug 2021
28 Aug 2021
28 Aug 2021
30 Aug 2021