The first step in the decision analysis process is problem formulation. We begin with a verbal statement of the problem. We then identify the decision alternatives, the uncertain future events, referred to as chance events, and the consequences associated with each decision alternative and each chance event outcome. Let us begin by considering a construction project for the Pittsburgh Development Corporation.
Pittsburgh Development Corporation (PDC) purchased land that will be the site of a new luxury condominium complex. The location provides a spectacular view of downtown Pittsburgh and the Golden Triangle where the Allegheny and Monongahela Rivers meet to form the Ohio River. PDC plans to price the individual condominium units between $300,000 and $1,400,000.
PDC commissioned preliminary architectural drawings for three different-sized projects: one with 30 condominiums, one with 60 condominiums, and one with 90 condominiums. The financial success of the project depends upon the size of the condominium complex and the chance event concerning the demand for the condominiums. The statement of the PDC decision problem is to select the size of the new luxury condominium project that will lead to the largest profit given the uncertainty concerning the demand for the condominiums.
Given the statement of the problem, it is clear that the decision is to select the best size for the condominium complex. PDC has the following three decision alternatives:
d1 = a small complex with 30 condominiums
d2 = a medium complex with 60 condominiums
d3 = a large complex with 90 condominiums
A factor in selecting the best decision alternative is the uncertainty associated with the chance event concerning the demand for the condominiums. When asked about the possible demand for the condominiums, PDC’s president acknowledged a wide range of possibilities but decided that it would be adequate to consider two possible chance event outcomes: a strong demand and a weak demand.
In decision analysis, the possible outcomes for a chance event are referred to as the states of nature. The states of nature are defined so that one and only one of the possible states of nature will occur. For the PDC problem, the chance event concerning the demand for the condominiums has two states of nature:
s1 = strong demand for the condominiums
s2 = weak demand for the condominiums
Management must first select a decision alternative (complex size), then a state of nature follows (demand for the condominiums), and finally a consequence will occur. In this case, the consequence is PDC’s profit.
1. Payoff Tables
Given the three decision alternatives and the two states of nature, which complex size should PDC choose? To answer this question, PDC will need to know the consequence associated with each decision alternative and each state of nature. In decision analysis, we refer to the consequence resulting from a specific combination of a decision alternative and a state of nature as a payoff. A table showing payoffs for all combinations of decision alternatives and states of nature is a payoff table.
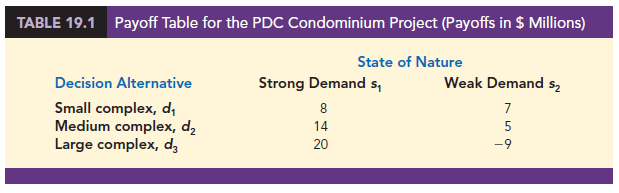
Because PDC wants to select the complex size that provides the largest profit, profit is used as the consequence. The payoff table with profits expressed in millions of dollars is shown in Table 19.1. Note, for example, that if a medium complex is built and demand turns out to be strong, a profit of $14 million will be realized. We will use the notation Vj to denote the payoff associated with decision alternative i and state of nature j. Using Table 19.1, V31 = 20 indicates a payoff of $20 million occurs if the decision is to build a large complex (d3) and the strong demand state of nature (s1) occurs. Similarly, V32 = -9 indicates a loss of $9 million if the decision is to build a large complex (d3) and the weak demand state of nature (s2) occurs.
2. Decision Trees
A decision tree graphically shows the sequential nature of the decision-making process. Figure 19.1 presents a decision tree for the PDC problem, demonstrating the natural or logical progression that will occur over time. First, PDC must make a decision regarding the size of the condominium complex (d1, d2, or d3). Then, after the decision is implemented, either state of nature s1 or s2 will occur. The number at each end point of the tree indicates the payoff associated with a particular sequence. For example, the topmost payoff of 8 indicates that an $8 million profit is anticipated if PDC constructs a small condominium complex (d1) and demand turns out to be strong (s1). The next payoff of 7 indicates an anticipated profit of $7 million if PDC constructs a small condominium complex (d1) and demand turns out to be weak (s2). Thus, the decision tree shows graphically the sequences of decision alternatives and states of nature that provide the six possible payoffs.
The decision tree in Figure 19.1 has four nodes, numbered 1-4, that represent the decisions and chance events. Squares are used to depict decision nodes and circles are used to depict chance nodes. Thus, node 1 is a decision node, and nodes 2, 3, and 4 are chance nodes. The branches leaving the decision node correspond to the decision alternatives. The branches leaving each chance node correspond to the states of nature. The payoffs are shown at the end of the states-of-nature branches. We now turn to the question: How can the decision maker use the information in the payoff table or the decision tree to select the best decision alternative? Several alternative approaches are covered in the remaining sections of this chapter.
Source: Anderson David R., Sweeney Dennis J., Williams Thomas A. (2019), Statistics for Business & Economics, Cengage Learning; 14th edition.
23 Oct 2019
30 Aug 2021
30 Aug 2021
31 Aug 2021
30 Aug 2021
30 Aug 2021