Most people are risk averse. Given a choice, they prefer fixed monthly incomes to those which, though equally large on average, fluctuate randomly from month to month. Yet many of these same people will invest all or part of their savings in stocks, bonds, and other assets that carry some risk. Why do risk- averse people invest in the stock market and thereby risk losing part or all of their investments?10 How do people decide how much risk to bear when making investments and planning for the future? To answer these questions, we must examine the demand for risky assets.
1. Assets
An asset is something that provides a flow of money or services to its owner. A home, an apartment building, a savings account, or shares of General Motors stock are all assets. A home, for example, provides a flow of housing services to its owner, and, if the owner did not wish to live there, could be rented out, thereby provid- ing a monetary flow. Likewise, apartments can be rented out, providing a flow of rental income to the owner of the building. A savings account pays interest (usually every day or every month), which is usually reinvested in the account.
The monetary flow that one receives from asset ownership can take the form of an explicit payment, such as the rental income from an apartment build- ing: Every month, the landlord receives rent checks from the tenants. Another form of explicit payment is the dividend on shares of common stock: Every three months, the owner of a share of General Motors stock receives a quarterly dividend payment.
But sometimes the monetary flow from ownership of an asset is implicit: It takes the form of an increase or decrease in the price or value of the asset. An increase in the value of an asset is a capital gain; a decrease is a capital loss. For example, as the population of a city grows, the value of an apartment building may increase. The owner of the building will then earn a capital gain beyond the rental income. The capital gain is unrealized until the building is sold because no money is actually received until then. There is, however, an implicit mon- etary flow because the building could be sold at any time. The monetary flow from owning General Motors stock is also partly implicit. The price of the stock changes from day to day, and each time it does, owners gain or lose.
2. Risky and Riskless Assets
A risky asset provides a monetary flow that is at least in part random. In other words, the monetary flow is not known with certainty in advance. A share of General Motors stock is an obvious example of a risky asset: You cannot know whether the price of the stock will rise or fall over time, nor can you even be sure that the company will continue to pay the same (or any) dividend per share. Although people often associate risk with the stock market, most other assets are also risky.
An apartment building is one example. You cannot know how much land values will rise or fall, whether the building will be fully rented all the time, or even whether the tenants will pay their rents promptly. Corporate bonds are another example—the issuing corporation could go bankrupt and fail to pay bond owners their interest and principal. Even long-term U.S. gov- ernment bonds that mature in 10 or 20 years are risky. Although it is highly unlikely that the federal government will go bankrupt, the rate of inflation could unexpectedly increase and make future interest payments and the eventual repayment of principal worth less in real terms, thereby reducing the value of the bonds.
In contrast, a riskless (or risk-free) asset pays a monetary flow that is known with certainty. Short-term U.S. government bonds—called Treasury bills—are riskless, or almost riskless. Because they mature in a few months, there is very little risk from an unexpected increase in the rate of inflation. You can also be reasonably confident that the U.S. government will not default on the bond (i.e., refuse to pay back the holder when the bond comes due). Other examples of riskless or almost riskless assets include passbook savings accounts and short- term certificates of deposit.
3. Asset Returns
People buy and hold assets because of the monetary flows they provide. To compare assets with each other, it helps to think of this monetary flow relative to an asset’s price or value. The return on an asset is the total monetary flow it yields—including capital gains or losses—as a fraction of its price. For example, a bond worth $1000 today that pays out $100 this year (and every year) has a return of 10 percent.11 If an apartment building was worth $10 million last year, increased in value to $11 million this year, and also provided rental income (after expenses) of $0.5 million, it would have yielded a return of 15 percent over the past year. If a share of General Motors stock was worth $80 at the beginning of the year, fell to $72 by the end of the year, and paid a dividend of $4, it will have yielded a return of -5 percent (the dividend yield of 5 percent less the capital loss of 10 percent).
When people invest their savings in stocks, bonds, land, or other assets, they usually hope to earn a return that exceeds the rate of inflation. Thus, by delay- ing consumption, they can buy more in the future than they can by spending all their income now. Consequently, we often express the return on an asset in real—i.e., inflation-adjusted—terms. The real return on an asset is its simple (or nominal) return less the rate of inflation. For example, with an annual inflation rate of 5 percent, our bond, apartment building, and share of GM stock have yielded real returns of 5 percent, 10 percent, and −10 percent, respectively.
EXPECTED VERSUS ACTUAL RETURNS Because most assets are risky, an investor cannot know in advance what returns they will yield over the com- ing year. For example, our apartment building might have depreciated in value instead of appreciating, and the price of GM stock might have risen instead of fallen. However, we can still compare assets by looking at their expected returns. The expected return on an asset is the expected value of its return, i.e., the return that it should earn on average. In some years, an asset’s actual return may be much higher than its expected return and in some years much lower. Over a long period, however, the average return should be close to the expected return.
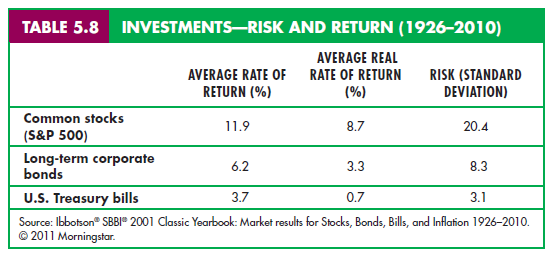
Different assets have different expected returns. Table 5.8, for example, shows that while the expected real return of a U.S. Treasury bill has been less than 1 percent, the expected real return on a group of representative stocks on the New York Stock Exchange has been more than 9 percent.12 Why would anyone buy a Treasury bill when the expected return on stocks is so much higher? Because the demand for an asset depends not just on its expected return, but also on its risk: Although stocks have a higher expected return than Treasury bills, they also carry much more risk. One measure of risk, the standard deviation of the real annual return, is equal to 20.4 percent for common stocks, 8.3 percent for corporate bonds, and only 3.1 percent for U.S. Treasury bills.
The numbers in Table 5.8 suggest that the higher the expected return on an investment, the greater the risk involved. Assuming that one’s investments are well diversified, this is indeed the case.13 As a result, the risk-averse investor must balance expected return against risk. We examine this trade-off in more detail in the next section.
4. The Trade-Off Between Risk and Return
Suppose a woman wants to invest her savings in two assets—Treasury bills, which are almost risk free, and a representative group of stocks. She must decide how much to invest in each asset. She might, for instance, invest only in Treasury bills, only in stocks, or in some combination of the two. As we will see, this problem is analogous to the consumer’s problem of allocating a budget between purchases of food and clothing.
Let’s denote the risk-free return on the Treasury bill by Rf. Because the return is risk free, the expected and actual returns are the same. In addition, let the expected return from investing in the stock market be Rm and the actual return be rm. The actual return is risky. At the time of the investment decision, we know the set of possible outcomes and the likelihood of each, but we do not know what particular outcome will occur. The risky asset will have a higher expected return than the risk-free asset (Rm > Rf). Otherwise, risk-averse investors would buy only Treasury bills and no stocks would be sold.
THE INVESTMENT PORTFOLIO To determine how much money the investor should put in each asset, let’s set b equal to the fraction of her savings placed in the stock market and (1 – b) the fraction used to purchase Treasury bills. The expected return on her total portfolio, Rp, is a weighted average of the expected return on the two assets:14
Rp = bRm + (1 – b)Rf (5.1)
Suppose, for example, that Treasury bills pay 4 percent (Rf = .04), the stock market’s expected return is 12 percent (Rm = .12), and b = 1/2. Then Rp = 8 percent. How risky is this portfolio? One measure of riskiness is the standard deviation of its return. We will denote the standard deviation of the risky stock market investment by am. With some algebra, we can show that the standard deviation of the portfolio, <rp (with one risky and one risk-free asset) is the fraction of the portfolio invested in the risky asset times the standard deviation of that
![]()
5. The Investor’s Choice Problem
We have still not determined how the investor should choose this fraction b. To do so, we must first show that she faces a risk-return trade-off analogous to a consumer ’s budget line. To identify this trade-off, note that equation (5.1) for the expected return on the portfolio can be rewritten as
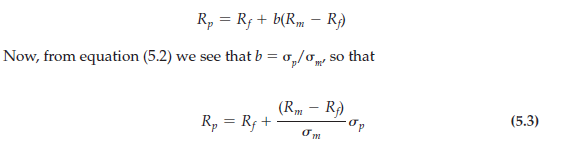
RISK AND THE BUDGET LINE This equation is a budget line because it describes the trade-off between risk (op) and expected return (Rp). Note that it is the equation for a straight line: Because Rm, Rf, and om are constants, the slope (Rm – Rf)/ om is a constant, as is the intercept, R. The equation says that the expected return on the portfolio Rp increases as the standard deviation of that return op increases. We call the slope of this budget line, (Rm – R)/om, the price of risk, because it tells us how much extra risk an investor must incur to enjoy a higher expected return.
The budget line is drawn in Figure 5.6. If our investor wants no risk, she can invest all her funds in Treasury bills (b = 0) and earn an expected return Rf. To receive a higher expected return, she must incur some risk. For example, she could invest all her funds in stocks (b = 1), earning an expected return Rm but incurring a standard deviation om. Or she might invest some fraction of her funds in each type of asset, earning an expected return somewhere between Rf and R and facing a standard deviation less than o but greater than zero.
RISK AND INDIFFERENCE CURVES Figure 5.6 also shows the solution to the investor’s problem. Three indifference curves are drawn in the figure. Each curve describes combinations of risk and return that leave the investor equally satisfied. The curves are upward-sloping because risk is undesirable. Thus, with a greater amount of risk, it takes a greater expected return to make the investor equally well-off. Curve U3 yields the greatest amount of satisfaction and U1 the least amount: For a given amount of risk, the investor earns a higher expected return on U3 than on U2 and a higher expected return on U2 than on U1.

Of the three indifference curves, the investor would prefer to be on U3. This position, however, is not feasible, because U3 does not touch the budget line. Curve U1 is feasible, but the investor can do better. Like the consumer choosing quantities of food and clothing, our investor does best by choosing a combination of risk and return at the point where an indifference curve (in this case U2) is tangent to the budget line. At that point, the investor’s return has an expected value R* and a standard deviation ct*.
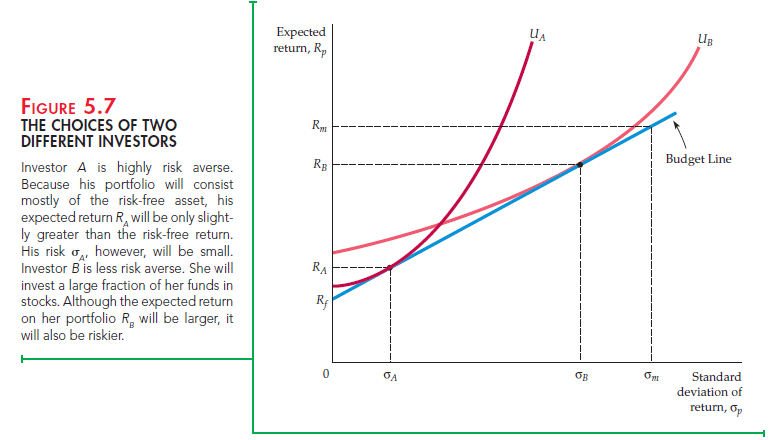
Naturally, people differ in their attitudes toward risk. This fact is illustrated in Figure 5.7, which shows how two different investors choose their portfolios. Investor A is quite risk averse. Because his indifference curve UA is tangent to the budget line at a point of low risk, he will invest almost all of his funds in Treasury bills and earn an expected return RA just slightly larger than the riskfree return R.. Investor B is less risk averse. She will invest most of her funds in stocks, and while the return on her portfolio will have a higher expected value Rb, it will also have a higher standard deviation ctb.
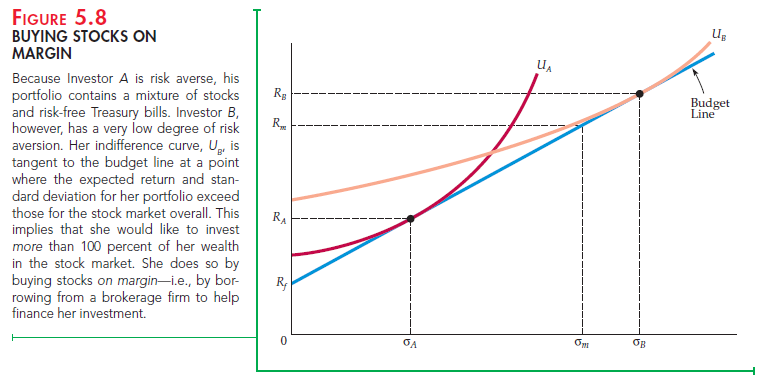
If Investor B has a sufficiently low level of risk aversion, she might buy stocks on margin: that is, she would borrow money from a brokerage firm in order to invest more than she actually owns in the stock market. In effect, a person who buys stocks on margin holds a portfolio with more than 100 percent of the portfolio’s value invested in stocks. This situation is illustrated in Figure 5.8, which shows indifference curves for two investors. Investor A, who is relatively risk-averse, invests about half of his funds in stocks. Investor B, however, has an indifference curve that is relatively flat and tangent with the budget line at a point where the expected return on the portfolio exceeds the expected return on the stock market. In order to hold this portfolio, the investor must borrow money because she wants to invest more than 100 percent of her wealth in the stock market. Buying stocks on margin in this way is a form of leverage: the investor increases her expected return above that for the overall stock market, but at the cost of increased risk.
In Chapters 3 and 4, we simplified the problem of consumer choice by assuming that the consumer had only two goods from which to choose— food and clothing. In the same spirit, we have simplified the investor ’s choice by limiting it to Treasury bills and stocks. The basic principles, how- ever, would be the same if we had more assets (e.g., corporate bonds, land, and different types of stocks). Every investor faces a trade-off between risk and return.16 The degree of extra risk that each is willing to bear in order to earn a higher expected return depends on how risk averse he or she is. Less risk-averse investors tend to include a larger fraction of risky assets in their portfolios.
Source: Pindyck Robert, Rubinfeld Daniel (2012), Microeconomics, Pearson, 8th edition.
I like this post, enjoyed this one regards for putting up.
Its like you read my mind! You appear to know so much about this, like you wrote the book in it or something. I think that you could do with some pics to drive the message home a bit, but other than that, this is excellent blog. A great read. I’ll certainly be back.