Investors separate growth stocks from income stocks. They buy growth stocks primarily for the expectation of capital gains, and they are interested in the future growth of earnings rather than in next year’s dividends. They buy income stocks primarily for the cash dividends. Let us see whether these distinctions make sense.
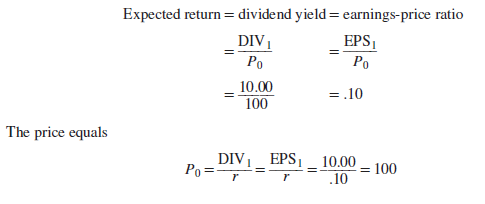
Imagine first the case of a company that does not grow at all. It does not plow back any earnings and simply produces a constant stream of dividends. Its stock would resemble the perpetual bond described in Chapter 2. Remember that the return on a perpetuity is equal to the yearly cash flow divided by the present value. So the expected return on our share would be equal to the yearly dividend divided by the share price (i.e., the dividend yield). Since all the earnings are paid out as dividends, the expected return is also equal to the earnings per share divided by the share price (i.e., the earnings-price ratio). For example, if the dividend is $10 a share and the stock price is $100, we have16
The expected return for growing firms can also equal the earnings-price ratio. The key is whether earnings are reinvested to provide a return equal to the market capitalization rate. For example, suppose our monotonous company suddenly hears of an opportunity to invest $10 a share next year. This would mean no dividend at t = 1. However, the company expects that in each subsequent year the project would earn $1 per share, and therefore the dividend could be increased to $11 a share.
Let us assume that this investment opportunity has about the same risk as the existing business. Then we can discount its cash flow at the 10% rate to find its net present value at year 1:
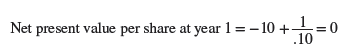
Thus, the investment opportunity will make no contribution to the company’s value. Its prospective return is equal to the opportunity cost of capital.
What effect will the decision to undertake the project have on the company’s share price? Clearly none. The reduction in value caused by the nil dividend in year 1 is exactly offset by the increase in value caused by the extra dividends in later years. Therefore, once again the market capitalization rate equals the earnings-price ratio:
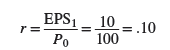
Table 4.7 repeats our example for different assumptions about the cash flow generated by the new project. Note that the earnings-price ratio, measured in terms of EPS1, next year’s expected earnings, equals the market capitalization rate (r) only when the new project’s NPV = 0. This is an extremely important point—managers can make poor financial decisions because they confuse earnings-price ratios with the market capitalization rate.
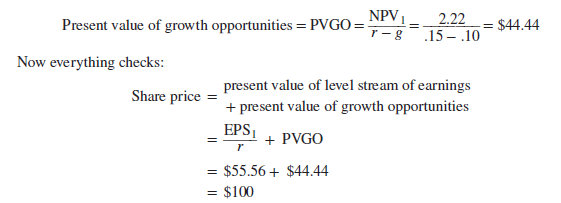
In general, we can think of stock price as the capitalized value of average earnings under a no-growth policy, plus PVGO, the net present value of growth opportunities:
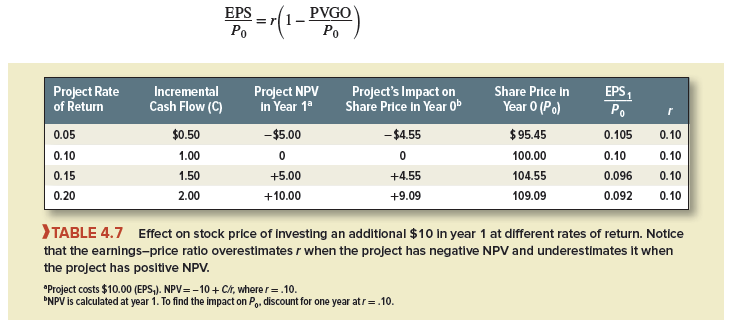
It will underestimate r if PVGO is positive and overestimate it if PVGO is negative. The latter case is less likely, since firms are rarely forced to take projects with negative net present values.
1. Calculating the Present Value of Growth Opportunities for Fledgling Electronics
In our last example, both dividends and earnings were expected to grow, but this growth made no net contribution to the stock price. The stock was, in this sense, an “income stock.” Be careful not to equate firm performance with the growth in earnings per share. A company that reinvests earnings at below the market capitalization rate r may increase earnings but will certainly reduce the share value.
Now let us turn to that well-known growth stock, Fledgling Electronics. You may remember that Fledgling’s market capitalization rate, r, is 15%. The company is expected to pay a dividend of $5 in the first year, and thereafter, the dividend is predicted to increase indefinitely by 10% a year. We can use the simplified constant-growth formula to work out Fledgling’s price:
![]()
Suppose that Fledgling has earnings per share of EPS1 = $8.33. Its payout ratio is then
![]()
In other words, the company is plowing back 1 – .6, or 40% of earnings. Suppose also that Fledgling’s ratio of earnings to book equity is ROE = .25. This explains the growth rate of 10%:
Growth rate = g = plowback ratio X ROE = .4 x .25 = .10
The capitalized value of Fledgling’s earnings per share if it had a no-growth policy would be
![]()
But we know that the value of Fledgling stock is $100. The difference of $44.44 must be the amount that investors are paying for growth opportunities. Let’s see if we can explain that figure.
Each year Fledgling plows back 40% of its earnings into new assets. In the first year, Fledgling invests $3.33 at a permanent 25% return on equity. Thus, the cash generated by this investment is .25 X 3.33 = $.83 per year starting at t = 2. The net present value of the investment as of t = 1 is
![]()
Everything is the same in year 2 except that Fledgling will invest $3.67, 10% more than in year 1 (remember g = .10). Therefore, at t = 2, an investment is made with a net present value of
![]()
Thus, the payoff to the owners of Fledgling Electronics stock can be represented as the sum of (1) a level stream of earnings, which could be paid out as cash dividends if the firm did not grow, and (2) a set of tickets, one for each future year, representing the opportunity to make investments having positive NPVs. We know that the first component of the value of the share is
Why is Fledgling Electronics a growth stock? Not because it is expanding at 10% per year. It is a growth stock because the net present value of its future investments accounts for a significant fraction (about 44%) of the stock’s price.
Today’s stock price reflects investor expectations about the earning power of the firm’s current and future assets. For example, take Alphabet, the parent company of Google. Alphabet has never paid a dividend. It plows back all its earnings into its business. In early 2018, its stock sold for $1,130 per share at a forward P/E of about 27. EPS forecasted for 2018 were $41.54.
Suppose that Alphabet did not grow and that future EPS were expected to stay constant at $41.54. In this case, Alphabet could pay a constant dividend of $41.54 per share. If the cost of equity is, say, 8%, market value would be PV = 41.54/.08 = $519.25 per share, about $611 less than the actual stock price of $1,130. So it appears that investors were valuing Alphabet’s future investment opportunities at $611 per share, about half of the stock price. Alphabet is a growth stock because that large fraction of its market value comes from the expected NPV of its future investments.
great post.Ne’er knew this, regards for letting me know.
Very interesting info!Perfect just what I was searching for!