A variable can be classified in a number of ways. The classification developed here results from looking at variables in three different ways (see Figure 5.1):
- the causal relationship;
- the study design;
- the unit of measurement.
1. From the viewpoint of causal relationship
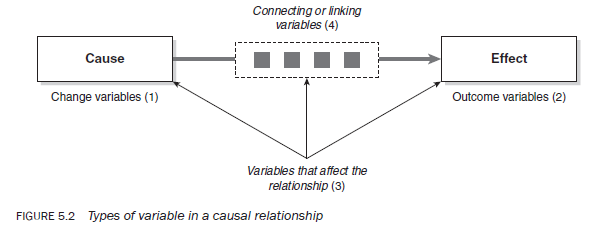
In studies that attempt to investigate a causal relationship or association, four sets of variables may operate (see Figure 5.2):
- change variables, which are responsible for bringing about change in a phenomenon, situation or circumstance;
- outcome variables, which are the effects, impacts or consequences of a change variable;
- variables which affect or influence the link between cause-and-effect variables;
- connecting or linking variables, which in certain situations are necessary to complete the relationship between cause-and-effect variables.
In research terminology, change variables are called independent variables, outcome/ effect variables are called dependent variables, the unmeasured variables affecting the cause-and-effect relationship are called extraneous variables and the variables that link a cause-and-effect relationship are called intervening variables. Hence:
- Independent variable – the cause supposed to be responsible for bringing about change(s) in a phenomenon or situation.
- Dependent variable – the outcome or change(s) brought about by introduction of an independent variable.
- Extraneous variable – several other factors operating in a real-life situation may affect changes in the dependent variable. These factors, not measured in the study, may increase or decrease the magnitude or strength of the relationship between independent and dependent variables.
- Intervening variable – sometimes called the confounding variable (Grinnell 1988: 203), it links the independent and dependent variables. In certain situations the relationship between an independent and a dependent variable cannot be established without the intervention of another variable. The cause, or independent, variable will have the assumed effect only in the presence of an intervening variable.

To explain these variables let us consider some examples. Suppose you want to study the relationship between smoking and cancer. You assume that smoking is a cause of cancer. Studies have shown that there are many factors affecting this relationship, such as the number of cigarettes or the amount of tobacco smoked every day; the duration of smoking; the age of the smoker; dietary habits; and the amount of exercise undertaken by the individual. All of these factors may affect the extent to which smoking might cause cancer. These variables may either increase or decrease the magnitude of the relationship.
In the above example the extent of smoking is the independent variable, cancer is the dependent variable and all the variables that might affect this relationship, either positively or negatively, are extraneous variables. See Figure 5.3.

Let us take another example. Suppose you want to study the effects of a marriage counselling service on marital problems among clients of an agency providing such a service. Figure 5.4 shows the sets of variables that may operate in studying the relationship between counselling and marriage problems.
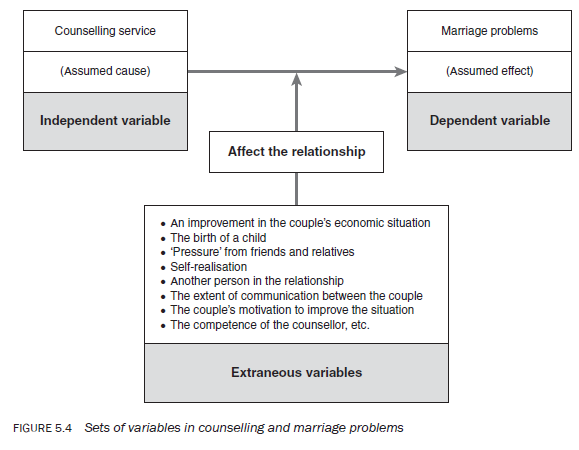
In studying the relationship between a counselling service and marriage problems, it is assumed that the counselling service will influence the extent of marital problems. Hence, in the study of the above relationship, the type of counselling service is the independent variable and the extent of marriage problems is the dependent variable. The magnitude or strength of this relationship can be affected, positively or negatively, by a number of other factors that are not the focus of the study. These extraneous variables might be the birth of a child; improvement in a couple’s economic situation; the couple’s motivation to change the situation; the involvement of another person; self-realisation; and pressure from relatives and friends. Extraneous variables that work both ways can increase or decrease the strength of the relationship.
The example in Figure 5.5 should help you to understand intervening variables. Suppose you want to study the relationship between fertility and mortality. Your aim is to explore what happens to fertility when mortality declines. The history of demographic transition has shown that a reduction in the fertility level follows a decline in the mortality level, though the time taken to attain the same level of reduction in fertility varied markedly from country to country. As such, there is no direct relationship between fertility and mortality. With the reduction in mortality, fertility will decline only if people attempt to limit their family size. History has shown that for a multiplicity of reasons (the discussion of which is beyond the scope of this book) people have used one method or another to control their fertility, resulting in lower fertility levels. It is thus the intervention of contraceptive methods that completes the relationship: the greater the use of contraceptives, the greater the decline in the fertility level and the sooner the adoption of contraceptive methods by people, the sooner the decline. The extent of the use of contraceptives is also affected by a number of other factors, for example attitudes towards contraception, level of education, socioeconomic status and age, religion, and provision and quality of health services. These are classified as extraneous variables.

In the above example, decline in mortality is assumed to be the cause of a reduction in fertility, hence the mortality level is the independent variable and fertility is the dependent variable. But this relationship will be completed only if another variable intervenes — that is, the use of contraceptives. A reduction in mortality (especially child mortality) increases family size, and an increase in family size creates a number of social, economic and psychological pressures on families, which in turn create attitudes favourable to a smaller family size. This change in attitudes is eventually operationalised in behaviour through the adoption of contraceptives. If people do not adopt methods of contraception, a change in mortality levels will not be reflected in fertility levels. The population explosion in developing countries is primarily due to lack of acceptance of contraceptives. The extent of the use of contraceptives determines the level of the decline in fertility. The extent of contraceptive adoption by a population is dependent upon a number of factors. As mentioned earlier, in this causal model, the fertility level is the dependent variable, the extent of contraceptive use is the intervening variable, the mortality level is the independent variable, and the unmeasured variables such as attitudes, education, age, religion, the quality of services, and so on, are all extraneous variables. Without the intervening variable the relationship between the independent and dependent variables will not be complete.
2. From the viewpoint of the study design
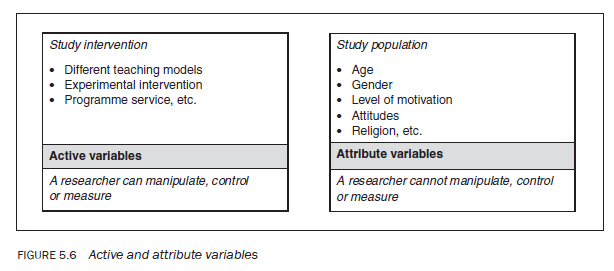
A study that examines association or causation may be a controlled/contrived experiment, a quasi-experiment or an ex post facto or non-experimental study. In controlled experiments the independent (cause) variable may be introduced or manipulated either by the researcher or by someone else who is providing the service. In these situations there are two sets of variables (see Figure 5.6):
- Active variables – those variables that can be manipulated, changed or controlled.
- Attribute variables – those variables that cannot be manipulated, changed or controlled, and that reflect the characteristics of the study population, for example age, gender, education and income.
Suppose a study is designed to measure the relative effectiveness of three teaching models (Model A, Model B and Model C). The structure and contents of these models could vary and any model might be tested on any population group. The contents, structure and testability of a model on a population group may also vary from researcher to researcher. On the other hand, a researcher does not have any control over characteristics of the student population such as their age, gender or motivation to study. These characteristics of the study population are called attribute variables. However, a researcher does have the ability to control and/or change the teaching models. S/he can decide what constitutes a teaching model and on which group of the student population it should be tested (if randomisation is not used).
3. From the viewpoint of the unit of measurement
From the viewpoint of the unit of measurement, there are two ways of categorising variables:
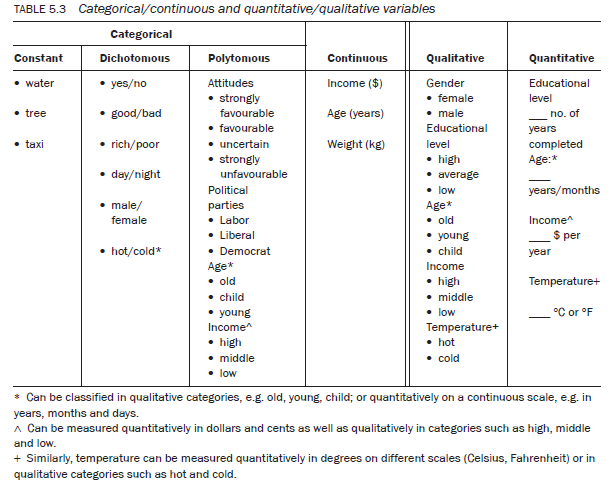
- whether the unit of measurement is categorical (as in nominal and ordinal scales) or continuous in nature (as in interval and ratio scales);
- whether it is qualitative (as in nominal and ordinal scales) or quantitative in nature (as in interval and ratio scales).
On the whole there is very little difference between categorical and qualitative, and between continuous and quantitative, variables. The slight difference between them is explained below.
Categorical variables are measured on nominal or ordinal measurement scales, whereas for continuous variables the measurements are made on either an interval or a ratio scale. There are three types of categorical variables:
- constant variable – has only one category or value, for example taxi, tree and water;
- dichotomous variable – has only two categories, as in male/female, yes/no, good/bad, head/ tail, up/down and rich/poor;
- polytomous variable – can be divided into more than two categories, for example religion (Christian, Muslim, Hindu); political parties (Labor, Liberal, Democrat); and attitudes (strongly favourable, favourable, uncertain, unfavourable, strongly unfavourable).
Continuous variables, on the other hand, have continuity in their measurement, for example age, income and attitude score. They can take any value on the scale on which they are measured. Age can be measured in years, months and days. Similarly, income can be measured in dollars and cents.
In many ways qualitative variables are similar to categorical variables as both use either nominal or ordinal measurement scales. However, there are some differences. For example, it is possible to develop categories on the basis of measurements made on a continuous scale, such as measuring the income of a population in dollars and cents and then developing categories such as ‘low’, ‘middle’ and ‘high’ income. The measurement of income in dollars and cents is classified as the measurement of a continuous variable, whereas its subjective measurement in categories such as ‘low’, ‘middle’ and ‘high’ groups is a qualitative variable.
Although this distinction exists, for most practical purposes there is no real difference between categorical and qualitative variables or between continuous and quantitative variables. Table 5.3 shows similarities and differences among the various types of variable.
For a beginner it is important to understand that the way a variable is measured determines the type of analysis that can be performed, the statistical procedures that can be applied to the data, the way the data can be interpreted and the findings that can be communicated.You may not realise in the beginning that the style of your report is entirely dependent upon the way the different variables have been measured — that is, the way a question has been asked and its response recorded. The way you measure the variables in your study determines whether a study is ‘qualitative’ or ‘quantitative’ in nature. It is therefore important to know about the measurement scales for variables.
Source: Kumar Ranjit (2012), Research methodology: a step-by-step guide for beginners, SAGE Publications Ltd; Third edition.
29 Jul 2021
29 Jul 2021
29 Jul 2021
29 Jul 2021
29 Jul 2021
30 Jul 2021