The procedures for estimating the mean value of y and predicting an individual value of y in multiple regression are similar to those in regression analysis involving one independent variable. First, recall that in Chapter 14 we showed that the point estimate of the expected value of y for a given value of x was the same as the point estimate of an individual value of y. In both cases, we used y = b0 + b1x as the point estimate.
In multiple regression we use the same procedure. That is, we substitute the given values of x1, x2,…, xp into the estimated regression equation and use the corresponding value of y as the point estimate. Suppose that for the Butler Trucking example we want to use the estimated regression equation involving x1 (miles traveled) and x 2 (number of deliveries) to develop two interval estimates:
- A confidence interval of the mean travel time for all trucks that travel 100 miles and make two deliveries
- A prediction interval of the travel time for one specific truck that travels 100 miles and makes two deliveries
Using the estimated regression equation y = -.869 + .06113x1 + .923x2 with x1 = 100 and x2 = 2, we obtain the following value of y.
y = -.869 + .06113(100) + .923(2) = 7.09
Hence, the point estimate of travel time in both cases is approximately seven hours.
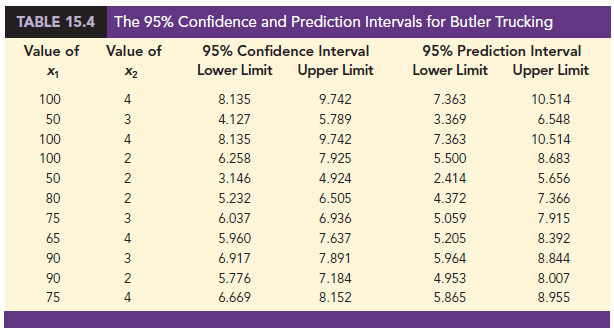
To develop interval estimates for the mean value of y and for an individual value of y, we use a procedure similar to that for regression analysis involving one independent variable. The formulas required are beyond the scope of the text, but statistical software for multiple regression analysis will often provide confidence intervals once the values of x1, x2, . . . , xp are specified by the user. In Table 15.4 we show the 95% confidence and prediction intervals for the Butler Trucking example for selected values of x1 and x2; these values were obtained with statistical software. Note that the interval estimate for an individual value of y is wider than the interval estimate for the expected value of y. This difference simply reflects the fact that for given values of x1 and x2 we can estimate the mean travel time for all trucks with more precision than we can predict the travel time for one specific truck.
Source: Anderson David R., Sweeney Dennis J., Williams Thomas A. (2019), Statistics for Business & Economics, Cengage Learning; 14th edition.
31 Aug 2021
31 Aug 2021
25 Jun 2026
30 Aug 2021
28 Aug 2021
28 Aug 2021