The hypergeometric probability distribution is closely related to the binomial distribution. The two probability distributions differ in two key ways. With the hypergeometric distribution, the trials are not independent; and the probability of success changes from trial to trial.
In the usual notation for the hypergeometric distribution, r denotes the number of elements in the population of size N labeled success, and N – r denotes the number of elements in the population labeled failure. The hypergeometric probability function is used to compute the probability that in a random selection of n elements, selected without replacement, we obtain x elements labeled success and n – x elements labeled failure. For this outcome to occur, we must obtain x successes from the r successes in the population and n – x failures from the N – r failures. The following hypergeometric probability function provides fx), the probability of obtaining x successes in n trials.
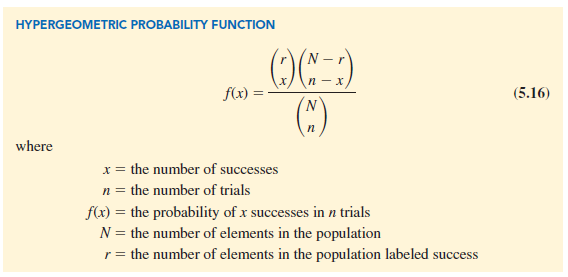
Note that ![]() represents the number of ways n elements can be selected from apopulation of size N;
represents the number of ways n elements can be selected from apopulation of size N;  represents the number of ways that x successes can be selected from a total of r successes in the population; and
 ![]() represents the number of ways that n − x failures can be selected from a total of N − r failures in the population.
represents the number of ways that n − x failures can be selected from a total of N − r failures in the population.
For the hypergeometric probability distribution, x is a discrete random variable and the probability function fix) given by equation (5.16) is usually applicable for values of x = 0, 1, 2, . . . , n. However, only values of x where the number of observed successes is less than or equal to the number of successes in the population (x < r) and where the number of observed failures is less than or equal to the number of failures in the population (n – x < N – r) are valid. If these two conditions do not hold for one or more values of x, the corresponding f(x) = 0 indicates that the probability of this value of x is zero.
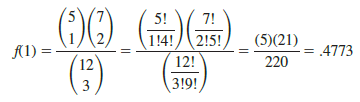
To illustrate the computations involved in using equation (5.16), let us consider the following quality control application. Electric fuses produced by Ontario Electric are packaged in boxes of 12 units each. Suppose an inspector randomly selects three of the 12 fuses in a box for testing. If the box contains exactly five defective fuses, what is the probability that the inspector will find exactly one of the three fuses defective? In this application, n = 3 and N = 12. With r = 5 defective fuses in the box the probability of finding x = 1 defective fuse is
Now suppose that we wanted to know the probability of finding at least one defective fuse. The easiest way to answer this question is to first compute the probability that the inspector does not find any defective fuses. The probability of x = 0 is

With a probability of zero defective fuses f(0) = .1591, we conclude that the probability of finding at least 1 defective fuse must be 1 – .1591 = .8409. Thus, there is a reasonably high probability that the inspector will find at least 1 defective fuse.
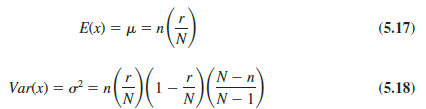
The mean and variance of a hypergeometric distribution are as follows.
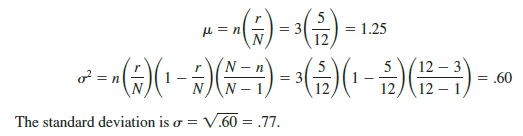
In the preceding example n = 3, r = 5, and N = 12. Thus, the mean and variance for the number of defective fuses are
Source: Anderson David R., Sweeney Dennis J., Williams Thomas A. (2019), Statistics for Business & Economics, Cengage Learning; 14th edition.
28 Aug 2021
30 Aug 2021
28 Aug 2021
30 Aug 2021
31 Aug 2021
31 Aug 2021