The experimental designs we have considered thus far enable us to draw statistical conclusions about one factor. However, in some experiments we want to draw conclusions about more than one variable or factor. A factorial experiment is an experimental design that allows simultaneous conclusions about two or more factors. The term factorial is used because the experimental conditions include all possible combinations of the factors. For example, for a levels of factor A and b levels of factor B, the experiment will involve collecting data on ab treatment combinations. In this section we will show the analysis for a two-factor factorial experiment. The basic approach can be extended to experiments involving more than two factors.
As an illustration of a two-factor factorial experiment, we will consider a study involving the Graduate Management Admissions Test (GMAT), a standardized test used by graduate schools of business to evaluate an applicant’s ability to pursue a graduate program in that field. Scores on the GMAT range from 200 to 800, with higher scores implying higher aptitude.
In an attempt to improve students’ performance on the GMAT, a major Texas university is considering offering the following three GMAT preparation programs.
- A three-hour review session covering the types of questions generally asked on the GMAT.
- A one-day program covering relevant exam material, along with the taking and grading of a sample exam.
- An intensive 10-week course involving the identification of each student’s weaknesses and the setting up of individualized programs for improvement.
Hence, one factor in this study is the GMAT preparation program, which has three treatments: three-hour review, one-day program, and 10-week course. Before selecting the preparation program to adopt, further study will be conducted to determine how the proposed programs affect GMAT scores.
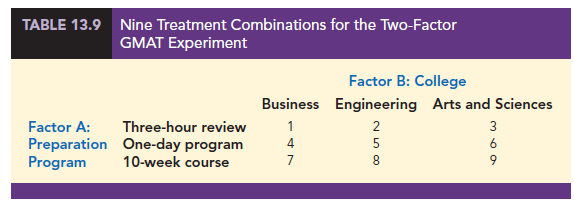
The GMAT is usually taken by students from three colleges: the College of Business, the College of Engineering, and the College of Arts and Sciences. Therefore, a second factor of interest in the experiment is whether a student’s undergraduate college affects the GMAT score. This second factor, undergraduate college, also has three treatments: business, engineering, and arts and sciences. The factorial design for this experiment with three treatments corresponding to factor A, the preparation program, and three treatments corresponding to factor B, the undergraduate college, will have a total of 3 X 3 = 9 treatment combinations. These treatment combinations or experimental conditions are summarized in Table 13.9.
Assume that a sample of two students will be selected corresponding to each of the nine treatment combinations shown in Table 13.9: Two business students will take the three- hour review, two will take the one-day program, and two will take the 10-week course. In addition, two engineering students and two arts and sciences students will take each of the three preparation programs. In experimental design terminology, the sample size of two for each treatment combination indicates that we have two replications. Additional replications and a larger sample size could easily be used, but we elect to minimize the computational aspects for this illustration.
This experimental design requires that 6 students who plan to attend graduate school be randomly selected from each of the three undergraduate colleges. Then 2 students from each college should be assigned randomly to each preparation program, resulting in a total of 18 students being used in the study.
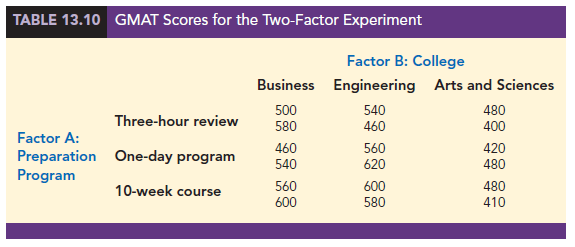
Let us assume that the randomly selected students participated in the preparation programs and then took the GMAT. The scores obtained are reported in Table 13.10.
The analysis of variance computations with the data in Table 13.10 will provide answers to the following questions.
- Main effect (factor A): Do the preparation programs differ in terms of effect on GMAT scores?
- Main effect (factor B): Do the undergraduate colleges differ in terms of effect on GMAT scores?
- Interaction effect (factors A and B): Do students in some colleges do better on one type of preparation program whereas others do better on a different type of preparation program?
The term interaction refers to a new effect that we can now study because we used a factorial experiment. If the interaction effect has a significant impact on the GMAT scores, we can conclude that the effect of the type of preparation program depends on the undergraduate college.
1. ANOVA Procedure
The ANOVA procedure for the two-factor factorial experiment requires us to partition the sum of squares total (SST) into four groups: sum of squares for factor A (SSA), sum of squares for factor B (SSB), sum of squares for interaction (SSAB), and sum of squares due to error (SSE). The formula for this partitioning follows.
SST = SSA + SSB + SSAB + SSE (13.26)
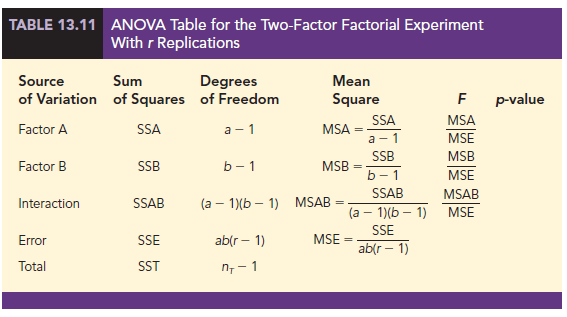
The partitioning of the sum of squares and degrees of freedom is summarized in Table 13.11. The following notation is used.
a = number of levels of factor A
b = number of levels of factor B
r = number of replications
nT = total number of observations taken in the experiment; nT = abr
2. Computations and Conclusions
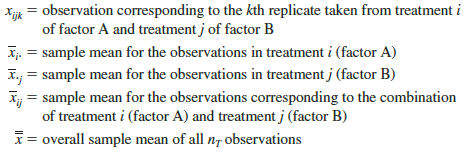
To compute the F statistics needed to test for the significance of factor A, factor B, and interaction, we need to compute MSA, MSB, MSAB, and MSE. To calculate these four mean squares, we must first compute SSA, SSB, SSAB, and SSE; in doing so we will also compute SST. To simplify the presentation, we perform the calculations in five steps. In addition to a, b, r, and nT as previously defined, the following notation is used.
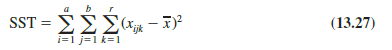
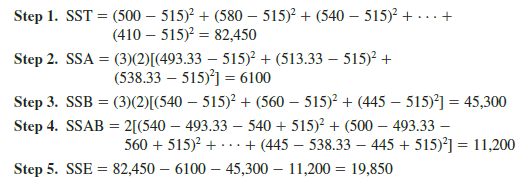
Step 1. Compute the total sum of squares.
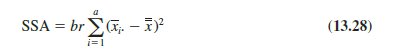
Step 2. Compute the sum of squares for factor A.
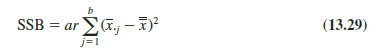
Step 3. Compute the sum of squares for factor B.
Step 4. Compute the sum of squares for interaction.
![]()
Step 5. Compute the sum of squares due to error.
SSE = SST 2 SSA 2 SSB 2 SSAB (13.31)
Table 13.12 reports the data collected in the experiment and the various sums that will help us with the sum of squares computations. Using equations (13.27) through (13.31), we calculate the following sums of squares for the GMAT two-factor factorial experiment.
These sums of squares divided by their corresponding degrees of freedom provide the appropriate mean square values for testing the two main effects (preparation program and undergraduate college) and the interaction effect.
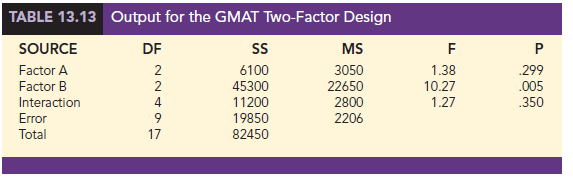
Because of the computational effort involved in any modest- to large-size factorial experiment, the computer usually plays an important role in performing the analysis of variance computations shown above and in the calculation of the p-values used to make the hypothesis testing decisions. Table 13.13 shows the output for the analysis of variance for the GMAT two-factor factorial experiment. Let us use the output and a level of significance a = .05 to conduct the hypothesis tests for the two-factor GMAT study. The p-value used to test for significant differences among the three preparation programs (Factor A) is .299. Because the p-value = .299 is greater than a = .05, there is no significant difference in the mean GMAT test scores for the three preparation programs. However, for the undergraduate college effect (Factor B), the p-value = .005 is less than a = .05; thus, there is a significant difference in the mean GMAT test scores among the three undergraduate colleges. Finally, because the p-value of .350 for the interaction effect is greater than a = .05, there is no significant interaction effect. Therefore, the study provides no reason to believe that the three preparation programs differ in their ability to prepare students from the different colleges for the GMAT.
Undergraduate college was found to be a significant factor. Checking the calculations in Table 13.12, we see that the sample means are: business students X.1 = 540, engineering students X.2 = 560, and arts and sciences students X.3 = 445. Tests on individual treatment means can be conducted, yet after reviewing the three sample means, we would anticipate no difference in preparation for business and engineering graduates. However, the arts and sciences students appear to be significantly less prepared for the GMAT than students in the other colleges. Perhaps this observation will lead the university to consider other options for assisting these students in preparing for the Graduate Management Admission Test.
Source: Anderson David R., Sweeney Dennis J., Williams Thomas A. (2019), Statistics for Business & Economics, Cengage Learning; 14th edition.
30 Aug 2021
31 Aug 2021
31 Aug 2021
30 Aug 2021
31 Aug 2021
31 Aug 2021