In today’s global business and economic environment, anyone can access vast amounts of statistical information. The most successful managers and decision makers understand the information and know how to use it effectively. In this section, we provide examples that illustrate some of the uses of statistics in business and economics.
Main contentsSee more from basic to advanced


1. Accounting
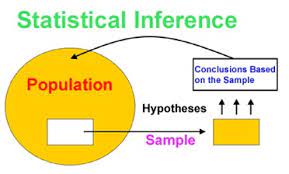
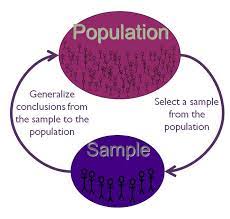
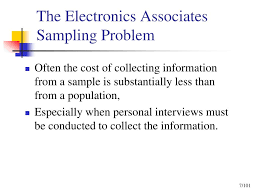
Public accounting firms use statistical sampling procedures when conducting audits for their clients. For instance, suppose an accounting firm wants to determine whether the amount of accounts receivable shown on a client’s balance sheet fairly represents the actual amount of accounts receivable. Usually the large number of individual accounts receivable makes reviewing and validating every account too time-consuming and expensive. As common practice in such situations, the audit staff selects a subset of the accounts called a sample. After reviewing the accuracy of the sampled accounts, the auditors draw a conclusion as to whether the accounts receivable amount shown on the client’s balance sheet is acceptable.
2. Finance
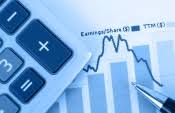
Financial analysts use a variety of statistical information to guide their investment recommendations. In the case of stocks, analysts review financial data such as price/ earnings ratios and dividend yields. By comparing the information for an individual stock with information about the stock market averages, an analyst can begin to draw a conclusion as to whether the stock is a good investment. For example, the average dividend yield for the S&P 500 companies for 2017 was 1.88%. Over the same period, the average dividend yield for Microsoft was 1.72% (Yahoo Finance). In this case, the statistical information on dividend yield indicates a lower dividend yield for Microsoft
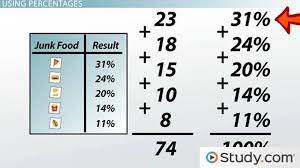
3. Marketing
Electronic scanners at retail checkout counters collect data for a variety of marketing research applications. For example, data suppliers such as The Nielsen Company and IRI purchase point-of-sale scanner data from grocery stores, process the data, and then sell statistical summaries of the data to manufacturers. Manufacturers spend hundreds of thousands of dollars per product category to obtain this type of scanner data. Manufacturers also purchase data and statistical summaries on promotional activities such as special pricing and the use of in-store displays. Brand managers can review the scanner statistics and the promotional activity statistics to gain a better understanding of the relationship between promotional activities and sales. Such analyses often prove helpful in establishing future marketing strategies for the various products.
4. Production
Today’s emphasis on quality makes quality control an important application of statistics in production. A variety of statistical quality control charts are used to monitor the output of a production process. In particular, an x-bar chart can be used to monitor the average output. Suppose, for example, that a machine fills containers with 12 ounces of a soft drink. Periodically, a production worker selects a sample of containers and computes the average number of ounces in the sample. This average, or x-bar value, is plotted on an x-bar chart. A plotted value above the chart’s upper control limit indicates overfilling, and a plotted value below the chart’s lower control limit indicates underfilling. The process is termed “in control” and allowed to continue as long as the plotted x-bar values fall between the chart’s upper and lower control limits. Properly interpreted, an x-bar chart can help determine when adjustments are necessary to correct a production process.
5. Economics
Economists frequently provide forecasts about the future of the economy or some aspect of it. They use a variety of statistical information in making such forecasts. For instance, in forecasting inflation rates, economists use statistical information on such indicators as the Producer Price Index, the unemployment rate, and manufacturing capacity utilization. Often these statistical indicators are entered into computerized forecasting models that predict inflation rates.
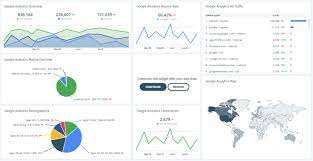
6. Information Systems
Information systems administrators are responsible for the day-to-day operation of an organization’s computer networks. A variety of statistical information helps administrators assess the performance of computer networks, including local area networks (LANs), wide area networks (WANs), network segments, intranets, and other data communication systems. Statistics such as the mean number of users on the system, the proportion of time any component of the system is down, and the proportion of bandwidth utilized at various times of the day are examples of statistical information that help the system administrator better understand and manage the computer network.
Applications of statistics such as those described in this section are an integral part of this text. Such examples provide an overview of the breadth of statistical applications. To supplement these examples, practitioners in the fields of business and economics provided chapter-opening Statistics in Practice articles that introduce the material covered in each chapter. The Statistics in Practice applications show the importance of statistics in a wide variety of business and economic situations.
Source: Anderson David R., Sweeney Dennis J., Williams Thomas A. (2019), Statistics for Business & Economics, Cengage Learning; 14th edition.
28 Aug 2021
28 Aug 2021
30 Aug 2021
30 Aug 2021
28 Aug 2021
31 Aug 2021