The purpose of statistical inference is to use sample data to quickly and inexpensively gain insight into some characteristic of a population. Therefore, it is important that we can expect the sample to look like, or be representative of, the population that is being investigated. In practice, individual samples always, to varying degrees, fail to be perfectly representative of the populations from which they have been taken. There are two general reasons a sample may fail to be representative of the population of interest: sampling error and nonsampling error.
1. Sampling Error
One reason a sample may fail to represent the population from which it has been taken is sampling error, or deviation of the sample from the population that results from random sampling. If repeated independent random samples of the same size are collected from the population of interest using a probability sampling technique, on average the samples will be representative of the population. This is the justification for collecting sample data randomly. However, the random collection of sample data does not ensure that any single sample will be perfectly representative of the population of interest; when collecting a sample randomly, the data in the sample cannot be expected to be perfectly representative of the population from which it has been taken. Sampling error is unavoidable when collecting a random sample; this is a risk we must accept when we chose to collect a random sample rather than incur the costs associated with taking a census of the population.
As expressed by equations (6.2) and (6.5), the standard errors of the sampling distributions of the sample mean x and the sample proportion of p reflect the potential for sampling error when using sample data to estimate the population mean m and the population proportion p, respectively. As the sample size n increases, the potential impact of extreme values on the statistic decreases, so there is less variation in the potential values of the statistic produced by the sample and the standard errors of these sampling distributions decrease. Because these standard errors reflect the potential for sampling error when using sample data to estimate the population mean m and the population proportion p, we see that for an extremely large sample there may be little potential for sampling error.
2. Nonsampling Error
Although the standard error of a sampling distribution decreases as the sample size n increases, this does not mean that we can conclude that an extremely large sample will always provide reliable information about the population of interest; this is because sampling error is not the sole reason a sample may fail to represent the target population. Deviations of the sample from the population that occur for reasons other than random sampling are referred to as nonsampling error. Nonsampling error can occur for a variety of reasons.
Consider the online news service PenningtonDailyTimes.com (PDT). Because PDT’s primary source of revenue is the sale of advertising, the news service is intent on collecting sample data on the behavior of visitors to its website in order to support its advertising sales. Prospective advertisers are willing to pay a premium to advertise on websites that have long visit times, so PDT’s management is keenly interested in the amount of time customers spend during their visits to PDT’s website. Advertisers are also concerned with how frequently visitors to a website click on any of the ads featured on the website, so PDT is also interested in whether visitors to its website clicked on any of the ads featured on PenningtonDailyTimes.com.
From whom should PDT collect its data? Should it collect data on current visits to Pen- ningtonDailyTimes.com? Should it attempt to attract new visitors and collect data on these visits? If so, should it measure the time spent at its website by visitors it has attracted from competitors’ websites or visitors who do not routinely visit online news sites? The answers to these questions depend on PDT’s research objectives. Is the company attempting to evaluate its current market, assess the potential of customers it can attract from competitors, or explore the potential of an entirely new market such as individuals who do not routinely obtain their news from online news services? If the research objective and the population from which the sample is to be drawn are not aligned, the data that PDT collects will not help the company accomplish its research objective. This type of error is referred to as a coverage error.
Even when the sample is taken from the appropriate population, nonsampling error can occur when segments of the target population are systematically underrepresented or overrepresented in the sample. This may occur because the study design is flawed or because some segments of the population are either more likely or less likely to respond. Suppose PDT implements a pop-up questionnaire that opens when a visitor leaves PenningtonDai- lyTimes.com. Visitors to PenningtonDailyTimes.com who have installed pop-up blockers will be likely underrepresented, and visitors to PenningtonDailyTimes. com who have not installed pop-up blockers will likely be overrepresented. If the behavior of PenningtonDa- ilyTimes.com visitors who have installed pop-up blockers differs from the behaviors of PenningtonDailyTimes.com visitors who have not installed pop-up blockers, attempting to draw conclusions from this sample about how all visitors to the PDT website behave may be misleading. This type of error is referred to as a nonresponse error.
Another potential source of nonsampling error is incorrect measurement of the characteristic of interest. If PDT asks questions that are ambiguous or difficult for respondents to understand, the responses may not accurately reflect how the respondents intended to respond. For example, respondents may be unsure how to respond if PDT asks “Are the news stories on PenningtonDailyTimes.com compelling and accurate?”. How should a visitor respond if she or he feels the news stories on PenningtonDailyTimes.com are compelling but erroneous? What response is appropriate if the respondent feels the news stories on PenningtonDailyTimes.com are accurate but dull? A similar issue can arise if a question is asked in a biased or leading way. If PDT asks “Many readers find the news stories on PenningtonDailyTimes.com to be compelling and accurate. Do you find the news stories on PenningtonDailyTimes.com to be compelling and accurate?”, the qualifying statement PDT makes prior to the actual question will likely result in a bias toward positive responses. Incorrect measurement of the characteristic of interest can also occur when respondents provide incorrect answers; this may be due to a respondent’s poor recall or unwillingness to respond honestly. This type of error is referred to as a measurement error.
Nonsampling error can introduce bias into the estimates produced using the sample, and this bias can mislead decision makers who use the sample data in their decision-making processes. No matter how small or large the sample, we must contend with this limitation of sampling whenever we use sample data to gain insight into a population of interest. Although sampling error decreases as the size of the sample increases, an extremely large sample can still suffer from nonsampling error and fail to be representative of the population of interest. When sampling, care must be taken to ensure that we minimize the introduction of nonsampling error into the data collection process. This can be done by carrying out the following steps:
- Carefully define the target population before collecting sample data, and subsequently design the data collection procedure so that a probability sample is drawn from this target population.
- Carefully design the data collection process and train the data collectors.
- Pretest the data collection procedure to identify and correct for potential sources of nonsampling error prior to final data collection.
- Use stratified random sampling when population-level information about an important qualitative variable is available to ensure that the sample is representative of the population with respect to that qualitative characteristic.
- Use cluster sampling when the population can be divided into heterogeneous subgroups or clusters.
- Use systematic sampling when population-level information about an important quantitative variable is available to ensure that the sample is representative of the population with respect to that quantitative characteristic.
Finally, recognize that every random sample (even an extremely large random sample) will suffer from some degree of sampling error, and eliminating all potential sources of nonsampling error may be impractical. Understanding these limitations of sampling will enable us to be more realistic and pragmatic when interpreting sample data and using sample data to draw conclusions about the target population.
3. Big Data
Recent estimates state that approximately 2.5 quintillion bytes of data are created worldwide each day. This represents a dramatic increase from the estimated 100 gigabytes (GB) of data generated worldwide per day in 1992, the 100 GB of data generated worldwide per hour in 1997, and the 100 GB of data generated worldwide per second in 2002. Every minute, there is an average of 216,000 Instagram posts, 204,000,000 emails sent, 12 hours of footage uploaded to YouTube, and 277,000 tweets posted on Twitter. Without question, the amount of data that is now generated is overwhelming, and this trend is certainly expected to continue.
In each of these cases the data sets that are generated are so large or complex that current data processing capacity and/or analytic methods are not adequate for analyzing the data. Thus, each is an example of big data. There are myriad other sources of big data. Sensors and mobile devices transmit enormous amounts of data. Internet activities, digital processes, and social media interactions also produce vast quantities of data.
The amount of data has increased so rapidly that our vocabulary for describing a data set by its size must expand. A few years ago, a petabyte of data seemed almost unimaginably large, but we now routinely describe data in terms of yottabytes. Table 7.6 summarizes terminology for describing the size of data sets.
4. Understanding What Big Data Is
The processes that generate big data can be described by four attributes or dimensions that are referred to as the four V’s:
- Volume—the amount of data generated
- Variety—the diversity in types and structures of data generated
- Veracity—the reliability of the data generated
- Velocity—the speed at which the data are generated

A high degree of any of these attributes individually is sufficient to generate big data, and when they occur at high levels simultaneously the resulting amount of data can be overwhelmingly large. Technological advances and improvements in electronic (and often automated) data collection make it easy to collect millions, or even billions, of observations in a relatively short time. Businesses are collecting greater volumes of an increasing variety of data at a higher velocity than ever.
To understand the challenges presented by big data, we consider its structural dimensions. Big data can be tall data; a data set that has so many observations that traditional statistical inference has little meaning. For example, producers of consumer goods collect information on the sentiment expressed in millions of social media posts each day to better understand consumer perceptions of their products. Such data consist of the sentiment expressed (the variable) in millions (or over time, even billions) of social media posts (the observations). Big data can also be wide data; a data set that has so many variables that simultaneous consideration of all variables is infeasible. For example, a high-resolution image can comprise millions or billions of pixels. The data used by facial recognition algorithms consider each pixel in an image when comparing an image to other images in an attempt to find a match. Thus, these algorithms make use of the characteristics of millions or billions of pixels (the variables) for relatively few high-resolution images (the observations). Of course, big data can be both tall and wide, and the resulting data set can again be overwhelmingly large.
Statistics are useful tools for understanding the information embedded in a big data set, but we must be careful when using statistics to analyze big data. It is important that we understand the limitations of statistics when applied to big data and we temper our interpretations accordingly. Because tall data are the most common form of big data used in business, we focus on this structure in the discussions throughout the remainder of this section.
5. Implications of Big Data for Sampling Error
Let’s revisit the data collection problem of online news service PenningtonDailyTimes. com (PDT). Because PDT’s primary source of revenue is the sale of advertising, PDT’s management is interested in the amount of time customers spend during their visits to
PDT’s website. From historical data, PDT has estimated that the standard deviation of the time spent by individual customers when they visit PDT’s website is s = 20 seconds. Table 7.7 shows how the standard error of the sampling distribution of the sample mean time spent by individual customers when they visit PDT’s website decreases as the sample size increases.
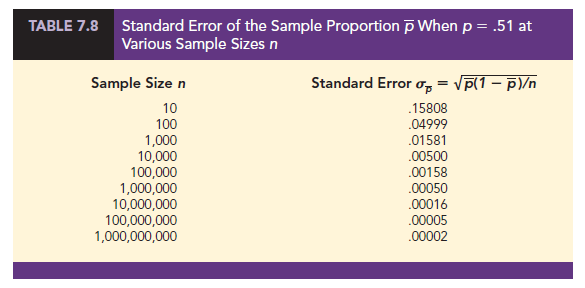
PDT also wants to collect information from its sample respondents on whether a visitor to its website clicked on any of the ads featured on the website. From its historical data, PDT knows that 51% of past visitors to its website clicked on an ad featured on the website, so it will use this value as p to estimate the standard error. Table 7.8 shows how the standard error of the sampling distribution of the proportion of the sample that clicked on any of the ads featured on PenningtonDailyTimes.com decreases as the sample size increases.

The PDT example illustrates the general relationship between standard errors and the sample size. We see in Table 7.7 that the standard error of the sample mean decreases as the sample size increases. For a sample of n = 10, the standard error of the sample mean is 6.32456; when we increase the sample size to n = 100,000, the standard error of the sample mean decreases to .06325; and at a sample size of n = 1,000,000,000, the standard error of the sample mean decreases to only .00063. In Table 7.8 we see that the standard error of the sample proportion also decreases as the sample size increases. For a sample of n = 10, the standard error of the sample proportion is .15808; when we increase the sample size to n = 100,000, the standard error of the sample proportion decreases to .00158; and at a sample size of n = 1,000,000,000, the standard error of the sample mean decreases to only .00002. In both Table 7.7 and Table 7.8, the standard error when n =1,000,000,000 is one ten-thousandth of the standard error when n = 10.
Source: Anderson David R., Sweeney Dennis J., Williams Thomas A. (2019), Statistics for Business & Economics, Cengage Learning; 14th edition.
30 Aug 2021
28 Aug 2021
30 Aug 2021
30 Aug 2021
31 Aug 2021
28 Aug 2021