Banks and other financial institutions not only want to know the value of the loans that they have made, but they also need to know the risk that they are incurring. Some rely on the judgments of specialized bond rating services. Others have developed their own models for measuring the probability that the borrower will default. We describe bond ratings first and then discuss two classes of model for predicting default.
The relative quality of most traded bonds can be judged by bond ratings. There are three principal rating services—Moody’s, Standard & Poor’s, and Fitch. Table 23.1 summarizes these ratings. For example, the highest-quality bonds are rated triple-A (Aaa) by Moody’s, then come double-A (Aa) bonds, and so on. Bonds rated Baa or above are known as investment-grade bonds. Commercial banks, many pension funds, and other financial institutions are not allowed to invest in bonds unless they are investment-grade.
Bonds rated below Baa are termed high-yield or junk bonds. Most junk bonds used to be fallen angels—that is, bonds of companies that had fallen on hard times. But during the 1980s, new issues of junk bonds multiplied 10-fold, as more and more companies issued large quantities of low-grade debt to finance takeovers. The result was that for the first time, corporate midgets were able to take control of corporate giants.
Issuers of these junk bonds often had debt ratios of 90% to 95%. Many worried that this threatened the health of corporate America and, as default rates on corporate debt rose to 10% in the early 1990s, the market for new issues of junk bonds dried up. Since then, the market for junk debt has had its ups and downs, but as interest rates on Treasuries dwindled in the years following the financial crisis, investors sought higher yields, and new issues of junk bonds boomed.

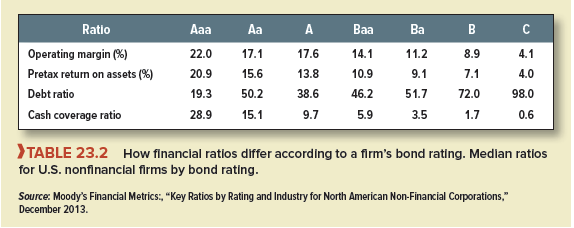
Bond ratings are judgments about firms’ financial and business prospects. There is no fixed formula by which ratings are calculated. Nevertheless, investment bankers, bond portfolio managers, and others who follow the bond market closely can get a fairly good idea of how a bond will be rated by looking at a few key numbers, such as the firm’s debt ratio, the ratio of earnings to interest, the operating margin, and the return on assets. Table 23.2 shows how these ratios vary with the firm’s bond rating.
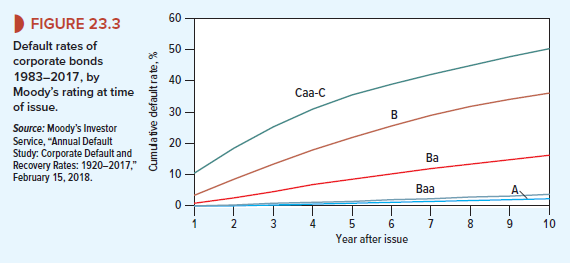
Figure 23.3 shows that bond ratings do reflect the probability of default. Since 1970, no U.S. bonds that were initially rated triple-A by Moody’s have defaulted in the year after issue and only 1 in 700 have defaulted within 10 years of issue. (The Aaa default rate is not plotted in Figure 23.3. It would be invisible.) At the other extreme, about half of Caa to C bonds have defaulted by year 10. Of course, bonds do not usually fall suddenly from grace. As time passes and the company becomes progressively more shaky, the agencies revise downward the bond’s rating to reflect the increasing probability of default.
Rating agencies don’t always get it right. When Enron went belly-up in 2001, investors protested that only two months earlier the company’s debt had an investment-grade rating. Rating agencies also did not win many friends during the financial crisis of 2007-2009, when many of the mortgage-backed debts that had been given triple-A ratings defaulted. And when agencies do downgrade a company’s debt, they are often accused of precipitate action that increases the cost of borrowing.
I like this site very much so much fantastic information.
Great write-up, I am regular visitor of one’s blog, maintain up the excellent operate, and It’s going to be a regular visitor for a long time.