We began our analysis of Home Depot by calculating how much value the company has added for its shareholders and how much profit it is earning after deducting the cost of the capital that it employs. We examined the company’s rates of return on capital, equity, and total assets and found that its return has been higher than the cost of capital. Our next task is to probe a little deeper to understand the reasons for the company’s success. What factors contribute to a firm’s overall profitability? One factor clearly must be the efficiency with which it uses its various assets.
Asset Turnover Ratio The asset turnover, or sales-to-assets, ratio shows how much sales volume is generated by each dollar of total assets, and therefore it measures how hard the firm’s assets are working. For Home Depot, each dollar of assets produced $2.35 of sales:
![]()
Technical note: Like a number of other financial ratios, the sales-to-assets ratio compares a flow measure (sales over the entire year) with a snapshot measure (assets at a point in time). But which point in time should you use? We calculated the ratio of Home Depot’s sales to assets at the start of the year, but frequently analysts use the average of the firm’s assets at the start and
end of the year. The idea is that this better measures the assets that the firm had to work with assets during the year.11 In the case of Home Depot, the two ratios are effectively identical:
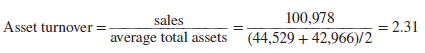
There is no obvious best measure. If assets are turned over very slowly, it may be better to use the value at the start of the year; if they are turned over fast, as is often the case, it may be preferable to use the average measure. However, it’s probably not worth getting too steamed up over the matter. After all, both measures rest on the doubtful assumption that the asset levels
at the close of each financial year are typical of the rest of the year. But, like many retailers, Home Depot ends its financial year in January/February just after the busy holiday season, when inventories and receivables are unusually low.
The asset turnover ratio measures how efficiently the business is using its entire asset base. But you also might be interested in how hard particular types of assets are being put to use. Here are a couple of examples.
Inventory Turnover Efficient firms don’t tie up more capital than they need in raw materials and finished goods. They hold only a relatively small level of inventories, and they turn over those inventories rapidly. The balance sheet shows the cost of inventories rather than the amount that the finished goods will eventually sell for. So it is usual to compare the level of inventories with the cost of goods sold rather than with sales. In Home Depot’s case,
![]()
Another way to express this measure is to look at how many days of output are represented by inventories. This is equal to the level of inventories divided by the daily cost of goods sold:
![]()
Receivables Turnover Receivables are sales for which the company has not yet been paid.
The receivables turnover ratio measures the firm’s sales as a proportion of its receivables. For Home Depot,
![]()
If customers are quick to pay, unpaid bills will be a relatively small proportion of sales and the receivables turnover will be high. Therefore, a comparatively high ratio often indicates an efficient credit department that is quick to follow up on late payers. Sometimes, however, a high ratio indicates that the firm has an unduly restrictive credit policy and offers credit only to customers who can be relied on to pay promptly.
Another way to measure the efficiency of the credit operation is by calculating the average length of time for customers to pay their bills. The faster the firm turns over its receivables, the shorter the collection period. Home Depot’s customers pay their bills in about 7.3 days:
![]()
The receivables turnover ratio and the inventory turnover ratio may help to highlight particular areas of inefficiency, but they are not the only possible indicators. For example, Home Depot might compare its sales per square foot with those of its competitors, a steel producer might calculate the cost per ton of steel produced, an airline might look at revenues per passenger-mile, and a law firm might look at revenues per partner. A little thought and common sense should suggest which measures are likely to produce the most helpful insights into your company’s efficiency.
23 Jun 2021
24 Jun 2021
25 Jun 2021
25 Jun 2021
23 Jun 2021
25 Jun 2021